
















Copyright: ©Author(s) 2026.
World J Hepatol. Mar 27, 2026; 18(3): 114768
Published online Mar 27, 2026. doi: 10.4254/wjh.v18.i3.114768
Published online Mar 27, 2026. doi: 10.4254/wjh.v18.i3.114768
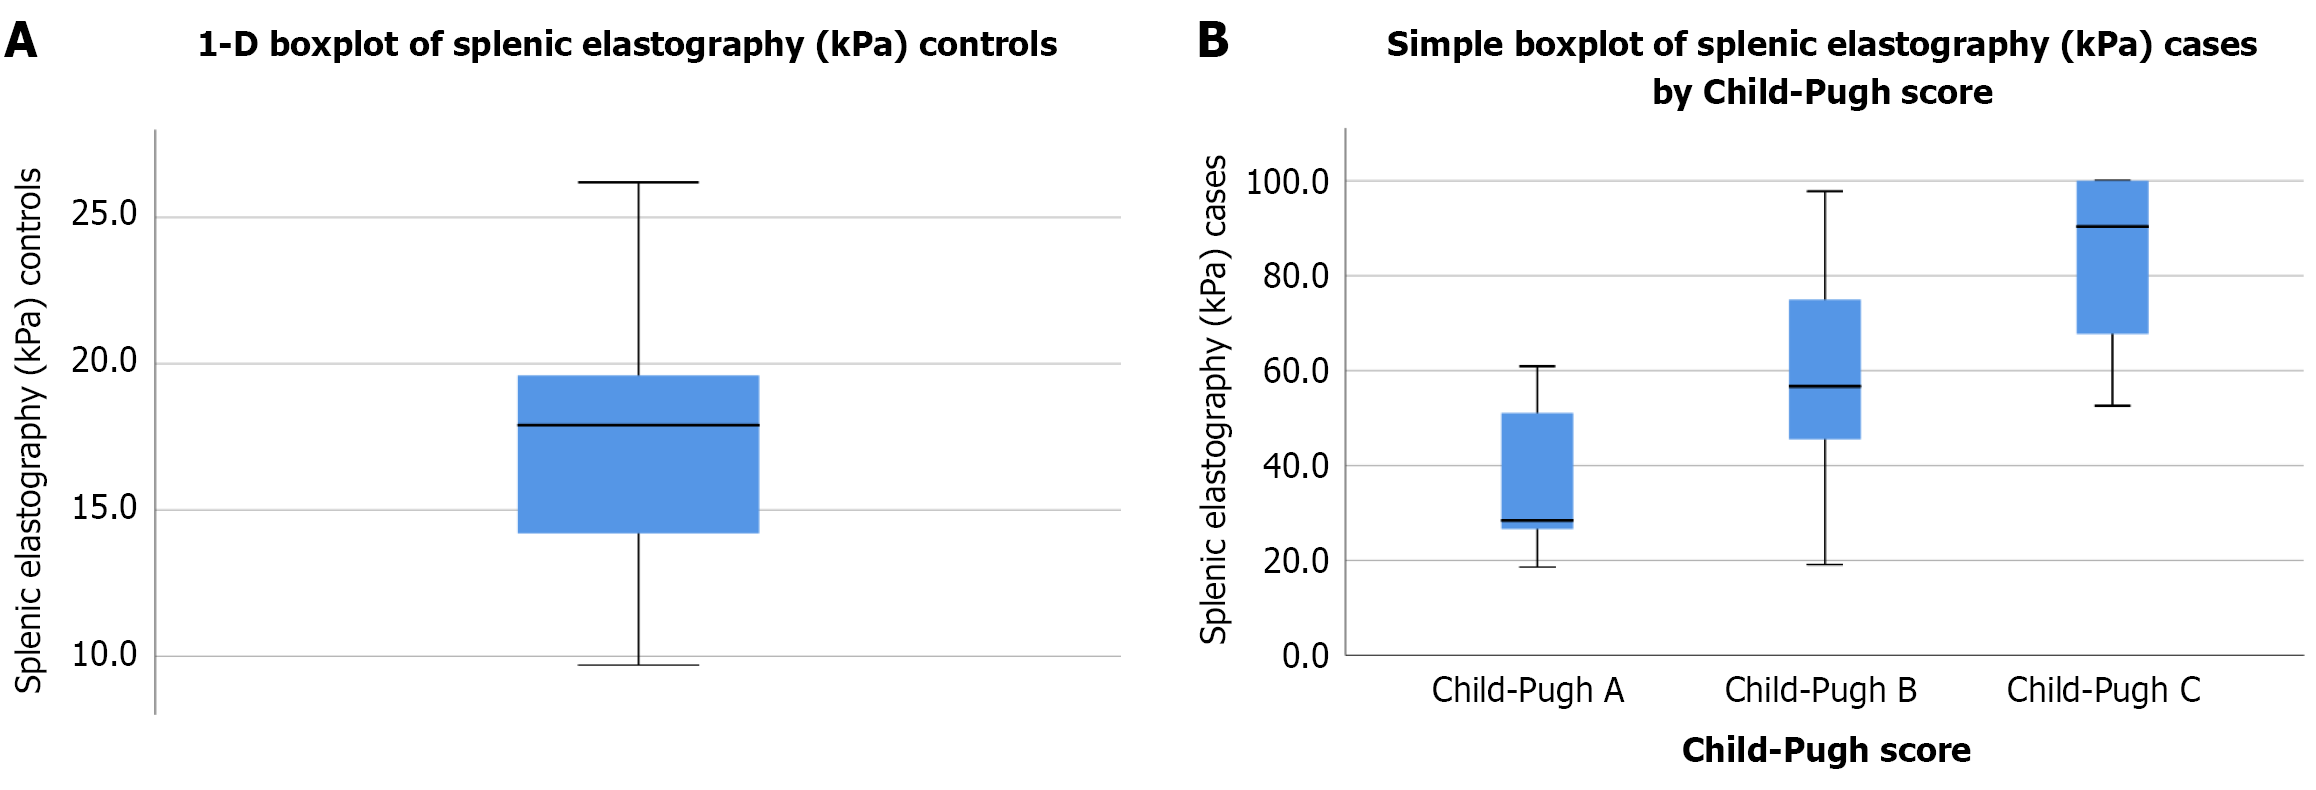
Figure 1 Boxplot.
A: Splenic stiffness in healthy controls. Y-axis: Splenic stiffness (kPa) among control group. X-axis: Control. Legend: Boxplot showing the median and interquartile range of splenic stiffness among healthy controls; B: Splenic elastography cases by Child-Pugh score. Y-axis: Splenic stiffness (kPa) among cirrhotic patients. X-axis: Child–Pugh A|B|C. Legend: Median stiffness increases with advancing class (P < 0.001, Kruskal-Wallis test).
- Citation: Saleh HT, Musa Y, Aminu AS, Abdullahi HZ, Samaila AA, Borodo MM. Splenic elastography in cirrhosis: A practical, non-invasive portal hypertension assessment from a Nigerian tertiary center. World J Hepatol 2026; 18(3): 114768
- URL: https://www.wjgnet.com/1948-5182/full/v18/i3/114768.htm
- DOI: https://dx.doi.org/10.4254/wjh.v18.i3.114768