
















Copyright: ©Author(s) 2026.
World J Hepatol. Mar 27, 2026; 18(3): 112850
Published online Mar 27, 2026. doi: 10.4254/wjh.v18.i3.112850
Published online Mar 27, 2026. doi: 10.4254/wjh.v18.i3.112850
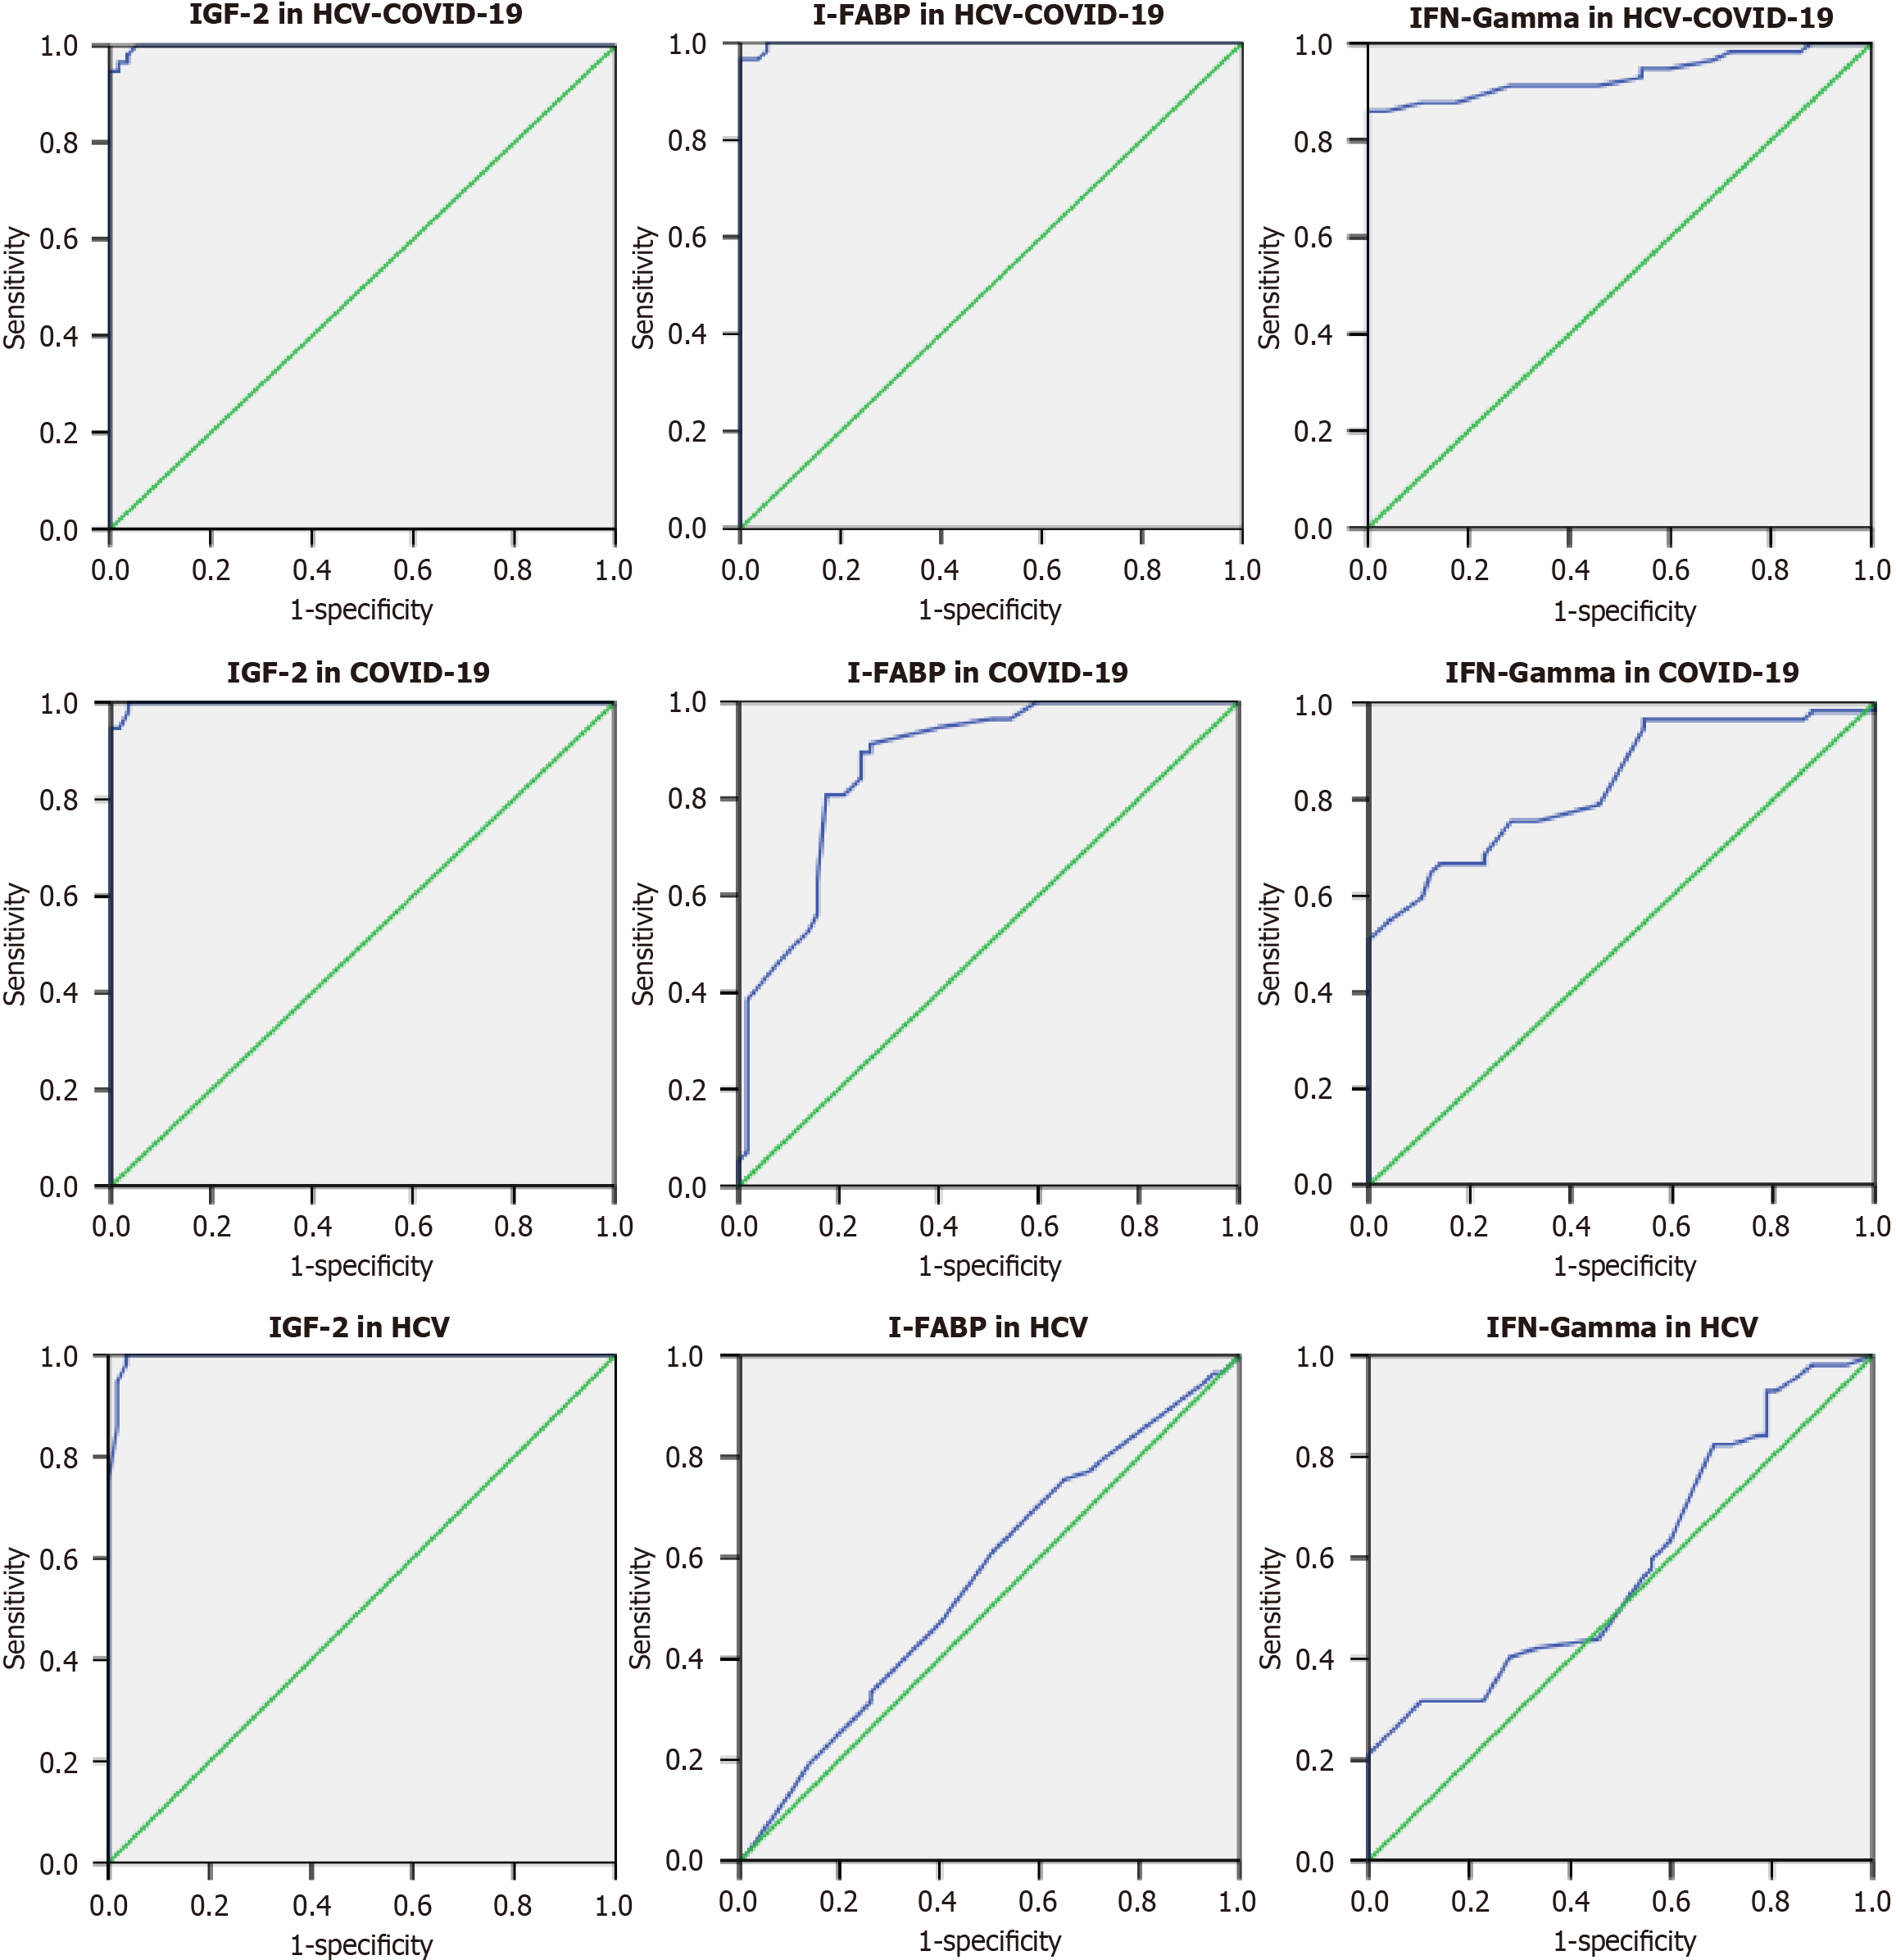
Figure 5 Receiver operating characteristic curves of insulin-like growth factor 2, intestinal fatty-acid-binding protein, and interferon-gamma for evaluating the sensitivity and specificity of insulin-like growth factor 2, intestinal fatty-acid-binding protein, and interferon-gamma in diagnosing infection.
The curves illustrate the diagnostic performance of each biomarker, with the area under the curve (AUC) values shown in the figure. Insulin-like growth factor 2 demonstrated excellent discrimination (AUC = 0.996), while I-FABP and interferon-gamma showed more modest performance (AUC = 0.736 and 0.684, respectively). The diagonal line represents the line of no discrimination (AUC = 0.5). Sensitivity and specificity are plotted across different thresholds. HCV: Hepatitis C virus; COVID-19: Coronavirus disease 2019; IFN: Interferon; IGF: Insulin-like growth factor; I-FABP: Intestinal fatty-acid-binding protein.
- Citation: Mohamed AA, Abdel-Hamid RM, Amin A, A Gawad EAH, Saed SM, Gaber DA, Ezz Al Arab M, El-Agawy W, AbuRahma MZA, Elosaily HH, Shaaban EE, Ismail SA, Sakr AA. Immunogenetic and molecular biomarkers in COVID-19 and hepatitis C virus infection: Evaluating the diagnostic potential of HLA (rs1131500), IGF-2, and I-FABP. World J Hepatol 2026; 18(3): 112850
- URL: https://www.wjgnet.com/1948-5182/full/v18/i3/112850.htm
- DOI: https://dx.doi.org/10.4254/wjh.v18.i3.112850