
















Copyright: ©Author(s) 2026.
World J Hepatol. Mar 27, 2026; 18(3): 112850
Published online Mar 27, 2026. doi: 10.4254/wjh.v18.i3.112850
Published online Mar 27, 2026. doi: 10.4254/wjh.v18.i3.112850
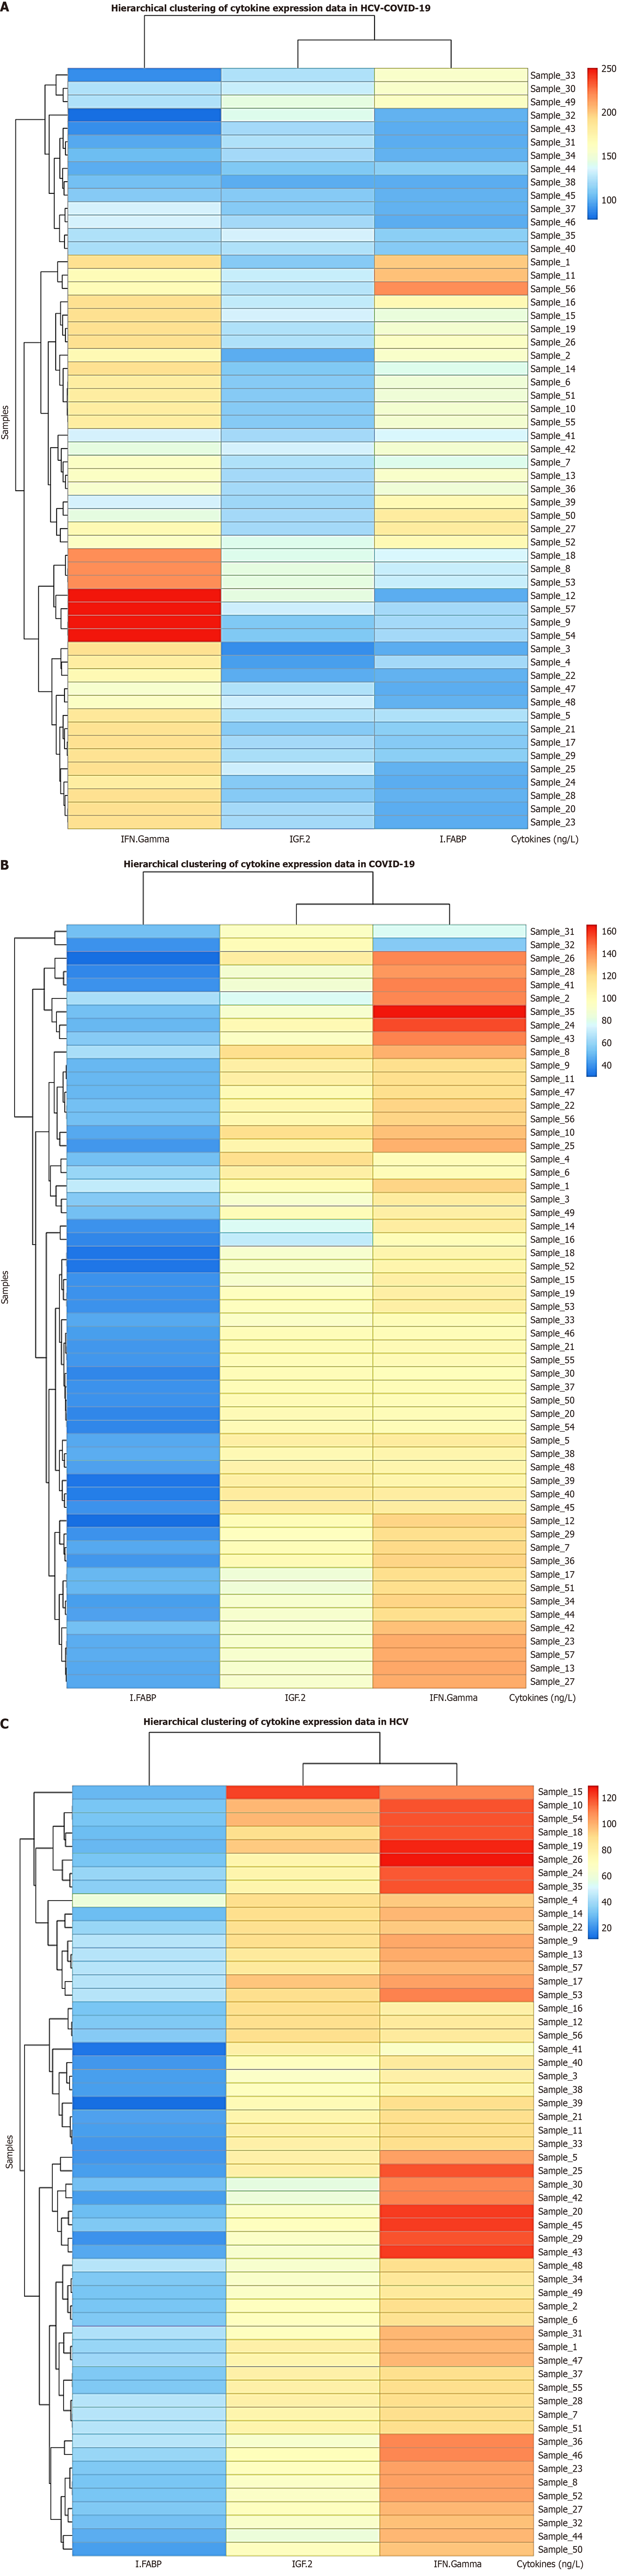
Figure 2 Heatmap showing the expression profiles of pro-inflammatory cytokines (insulin-like growth factor 2 [IGF-2], intestinal fatty-acid-binding protein [I-FABP], and interferon-gamma IFN-γ]) in A: Dual hepatitis C virus-coronavirus disease 2019 group; B: Coronavirus disease 2019 group; and C: Hepatitis C virus group.
Each row represents an individual patient sample, and each column represents a cytokine. Color intensity reflects relative expression levels, with red indicating higher expression and blue indicating lower expression. Hierarchical clustering was applied to both samples and cytokines to highlight patterns and similarities in cytokine expression across the cohort. IFN: Interferon; IGF: Insulin-like growth factor; I-FABP: Intestinal fatty-acid-binding protein.
- Citation: Mohamed AA, Abdel-Hamid RM, Amin A, A Gawad EAH, Saed SM, Gaber DA, Ezz Al Arab M, El-Agawy W, AbuRahma MZA, Elosaily HH, Shaaban EE, Ismail SA, Sakr AA. Immunogenetic and molecular biomarkers in COVID-19 and hepatitis C virus infection: Evaluating the diagnostic potential of HLA (rs1131500), IGF-2, and I-FABP. World J Hepatol 2026; 18(3): 112850
- URL: https://www.wjgnet.com/1948-5182/full/v18/i3/112850.htm
- DOI: https://dx.doi.org/10.4254/wjh.v18.i3.112850