
















©The Author(s) 2026.
World J Hepatol. Feb 27, 2026; 18(2): 111099
Published online Feb 27, 2026. doi: 10.4254/wjh.v18.i2.111099
Published online Feb 27, 2026. doi: 10.4254/wjh.v18.i2.111099
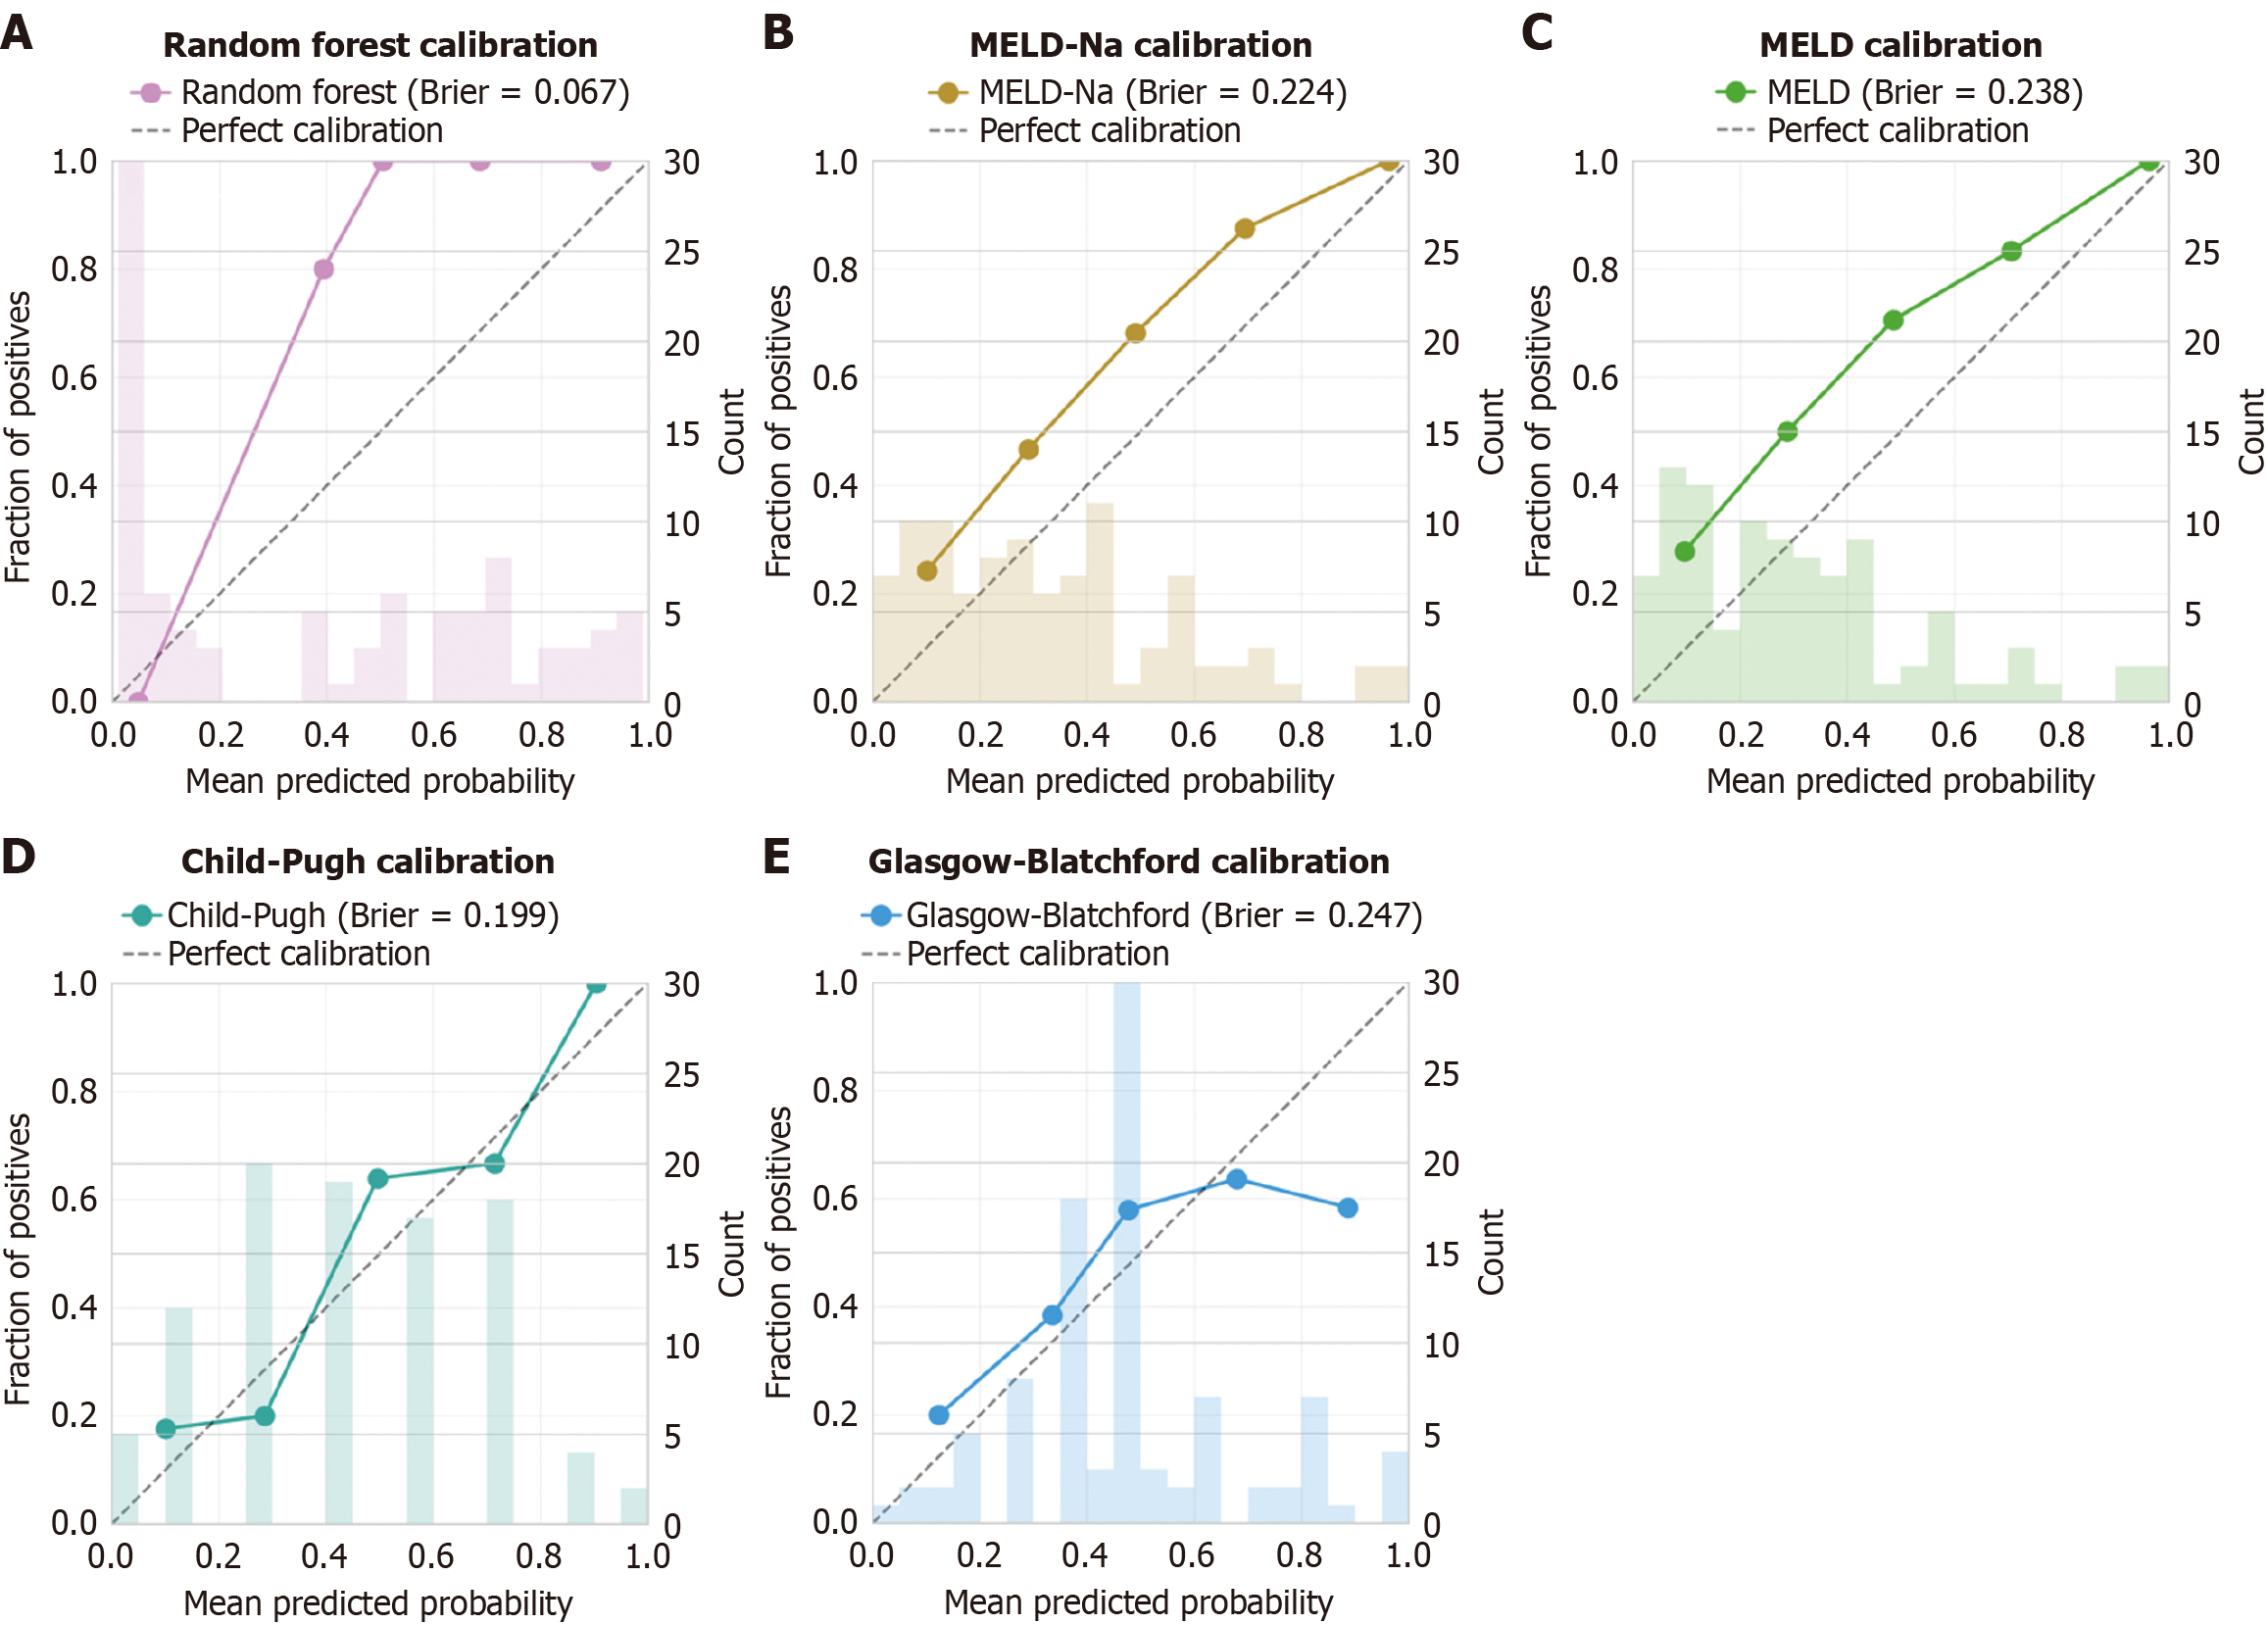
Figure 5 Calibration plots for mortality prediction models.
A: Random Forest; B: Model for end-stage liver disease-serum sodium; C: Model for end-stage liver disease; D: Child-Pugh; E: Glasgow-Blatchford scores. Calibration curves (solid lines) compare predicted probabilities (X-axis) with observed mortality rates (Y-axis). Perfect calibration is shown by the diagonal dashed line. Histograms display the distribution of predictions. The random forest model shows excellent calibration (Brier score = 0.067), while traditional scores show systematically poorer calibration (Brier scores 0.199-0.247). n = 97 patients from the retrospective cohort. MELD: Model for end-stage liver disease; MELD-Na: Model for end-stage liver disease-serum sodium.
- Citation: Rech MM, Corso LL, Dal Bó EF, Ferraza AD, Tomé F, Terres AZ, Balbinot RS, Balbinot RA, Balbinot SS, Soldera J. Development and prospective validation of a machine learning model to predict mortality in cirrhosis with esophageal variceal bleeding. World J Hepatol 2026; 18(2): 111099
- URL: https://www.wjgnet.com/1948-5182/full/v18/i2/111099.htm
- DOI: https://dx.doi.org/10.4254/wjh.v18.i2.111099