
















©The Author(s) 2026.
World J Hepatol. Feb 27, 2026; 18(2): 111099
Published online Feb 27, 2026. doi: 10.4254/wjh.v18.i2.111099
Published online Feb 27, 2026. doi: 10.4254/wjh.v18.i2.111099
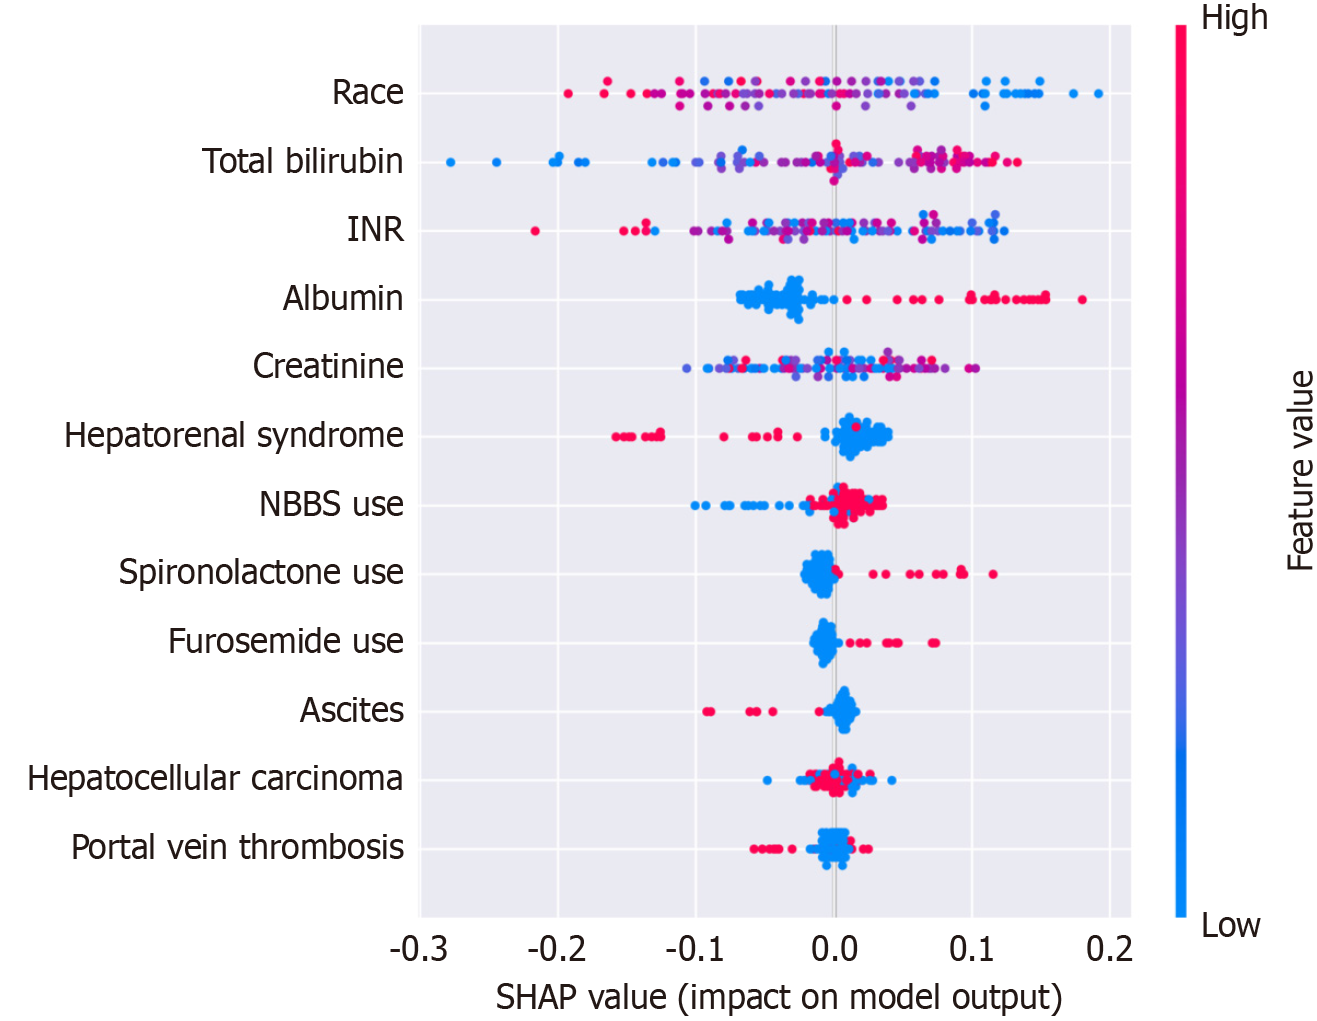
Figure 4 SHapley Additive exPlanations value distribution for predictor variables in the random forest model.
The X-axis represents SHapley Additive exPlanations values, indicating the magnitude and direction of each feature's impact on model output. Each point represents an individual observation, with color intensity indicating the feature value (blue: Low, red: High). Features are ordered by mean absolute SHapley Additive exPlanations value, with race showing the highest overall impact on model predictions. The vertical line at X = 0 represents no effect on model output. INR: International normalized ratio; NBBS: Non-selective beta-blockers; SHAP: SHapley Additive exPlanations.
- Citation: Rech MM, Corso LL, Dal Bó EF, Ferraza AD, Tomé F, Terres AZ, Balbinot RS, Balbinot RA, Balbinot SS, Soldera J. Development and prospective validation of a machine learning model to predict mortality in cirrhosis with esophageal variceal bleeding. World J Hepatol 2026; 18(2): 111099
- URL: https://www.wjgnet.com/1948-5182/full/v18/i2/111099.htm
- DOI: https://dx.doi.org/10.4254/wjh.v18.i2.111099