
















©The Author(s) 2026.
World J Hepatol. Feb 27, 2026; 18(2): 111099
Published online Feb 27, 2026. doi: 10.4254/wjh.v18.i2.111099
Published online Feb 27, 2026. doi: 10.4254/wjh.v18.i2.111099
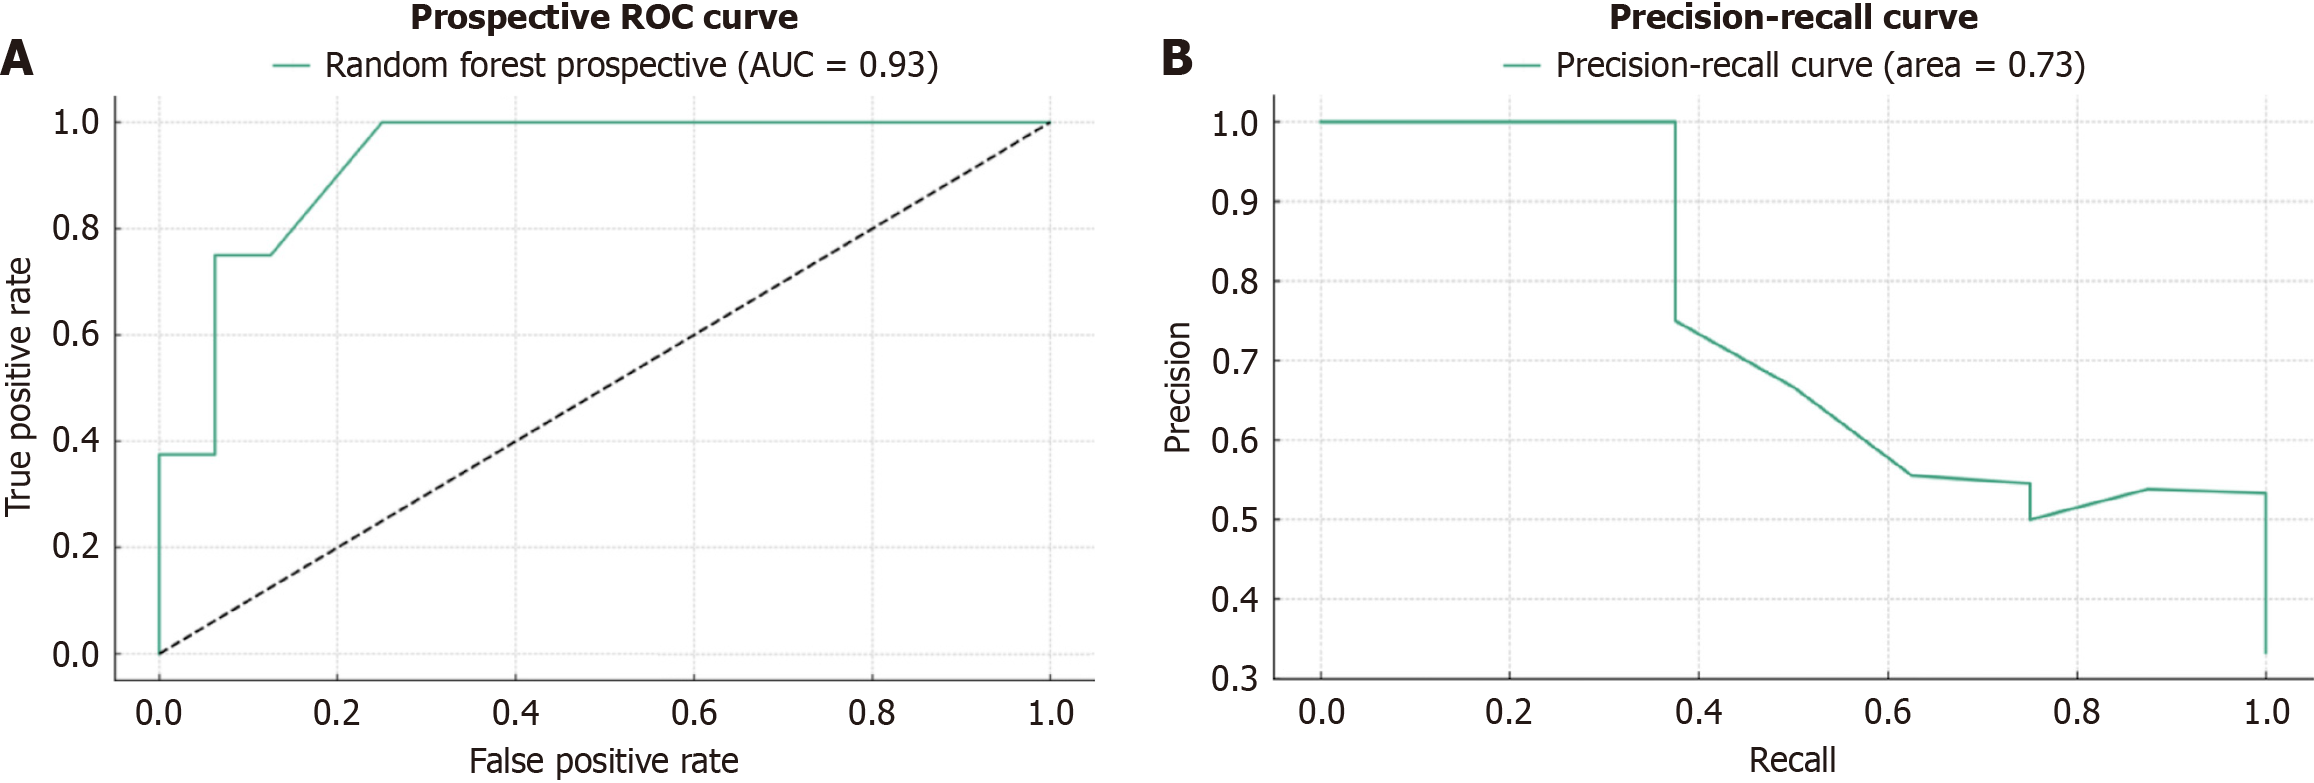
Figure 3 Performance evaluation of the random forest model in the prospective validation cohort.
A: Receiver operating characteristic (ROC) curve showing the relationship between true-positive rate and false-positive rate. The dashed line represents random prediction; B: Precision-recall curve demonstrating the model’s predictive performance across different classification thresholds. AUC: Area under the curve.
- Citation: Rech MM, Corso LL, Dal Bó EF, Ferraza AD, Tomé F, Terres AZ, Balbinot RS, Balbinot RA, Balbinot SS, Soldera J. Development and prospective validation of a machine learning model to predict mortality in cirrhosis with esophageal variceal bleeding. World J Hepatol 2026; 18(2): 111099
- URL: https://www.wjgnet.com/1948-5182/full/v18/i2/111099.htm
- DOI: https://dx.doi.org/10.4254/wjh.v18.i2.111099