
















Copyright: ©Author(s) 2026.
World J Hepatol. Oct 27, 2026; 18(10): 123353
Published online Oct 27, 2026. doi: 10.4254/wjh.123353
Published online Oct 27, 2026. doi: 10.4254/wjh.123353
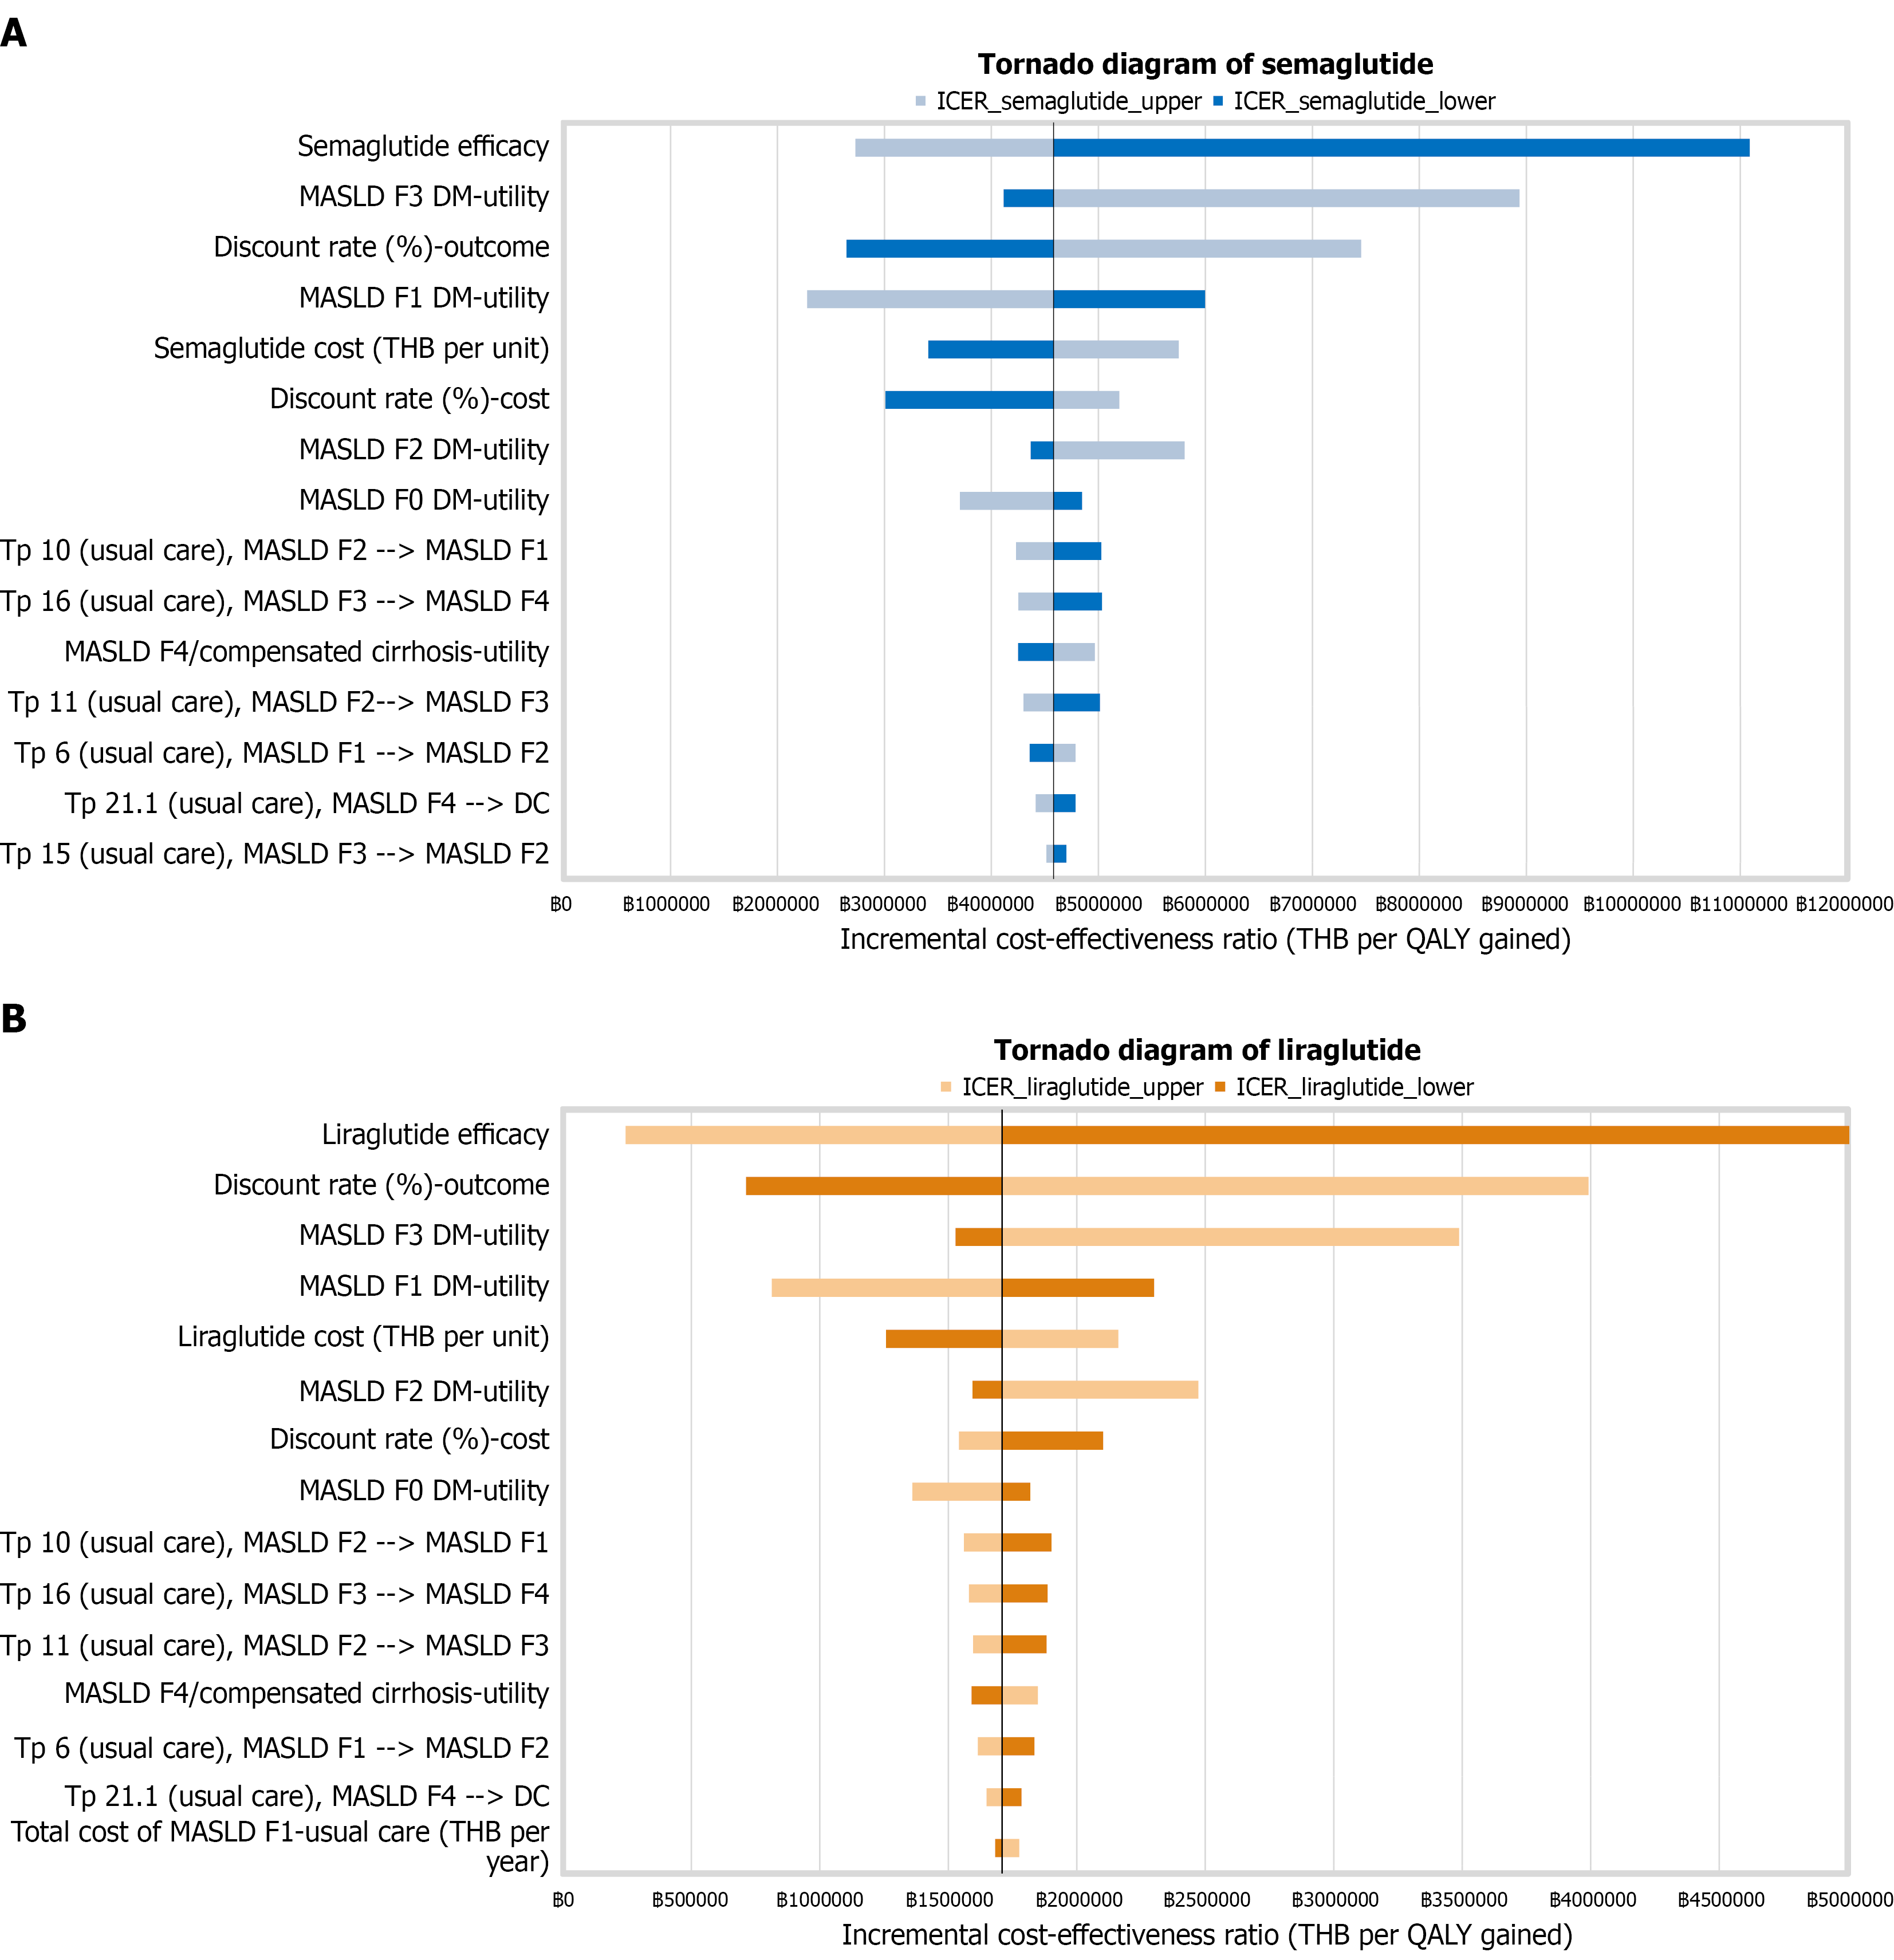
Figure 2 Tornado diagrams.
A: Semaglutide compared with usual care; B: Liraglutide compared with usual care. The vertical axis lists the model parameters ordered by their magnitude of influence on the incremental cost-effectiveness ratio (ICER). The horizontal axis shows the ICER range as each parameter is varied between its minimum and maximum value. DC: Decompensated cirrhosis; DM: Diabetes mellitus; F: Fibrosis stage; ICER: Incremental cost-effectiveness ratio; MASLD: Metabolic dysfunction-associated steatotic liver disease; QALY: Quality-adjusted life year; THB: Thai baht; Tp: Transition probability.
- Citation: Limwongse S, Chatpattanasiri P, Phuphuang P, Tungthaweethong K, Sutheerayongprasert K, Aunprom-Me W, Kositamongkol C, Phisalprapa P. Cost-utility analysis of glucagon-like peptide-1 receptor agonists for type 2 diabetes mellitus and metabolic dysfunction-associated steatotic liver disease in Thailand. World J Hepatol 2026; 18(10): 123353
- URL: https://www.wjgnet.com/1948-5182/full/v18/i10/123353.htm
- DOI: https://dx.doi.org/10.4254/wjh.123353