
















Copyright: ©Author(s) 2026.
World J Hepatol. Oct 27, 2026; 18(10): 123353
Published online Oct 27, 2026. doi: 10.4254/wjh.123353
Published online Oct 27, 2026. doi: 10.4254/wjh.123353
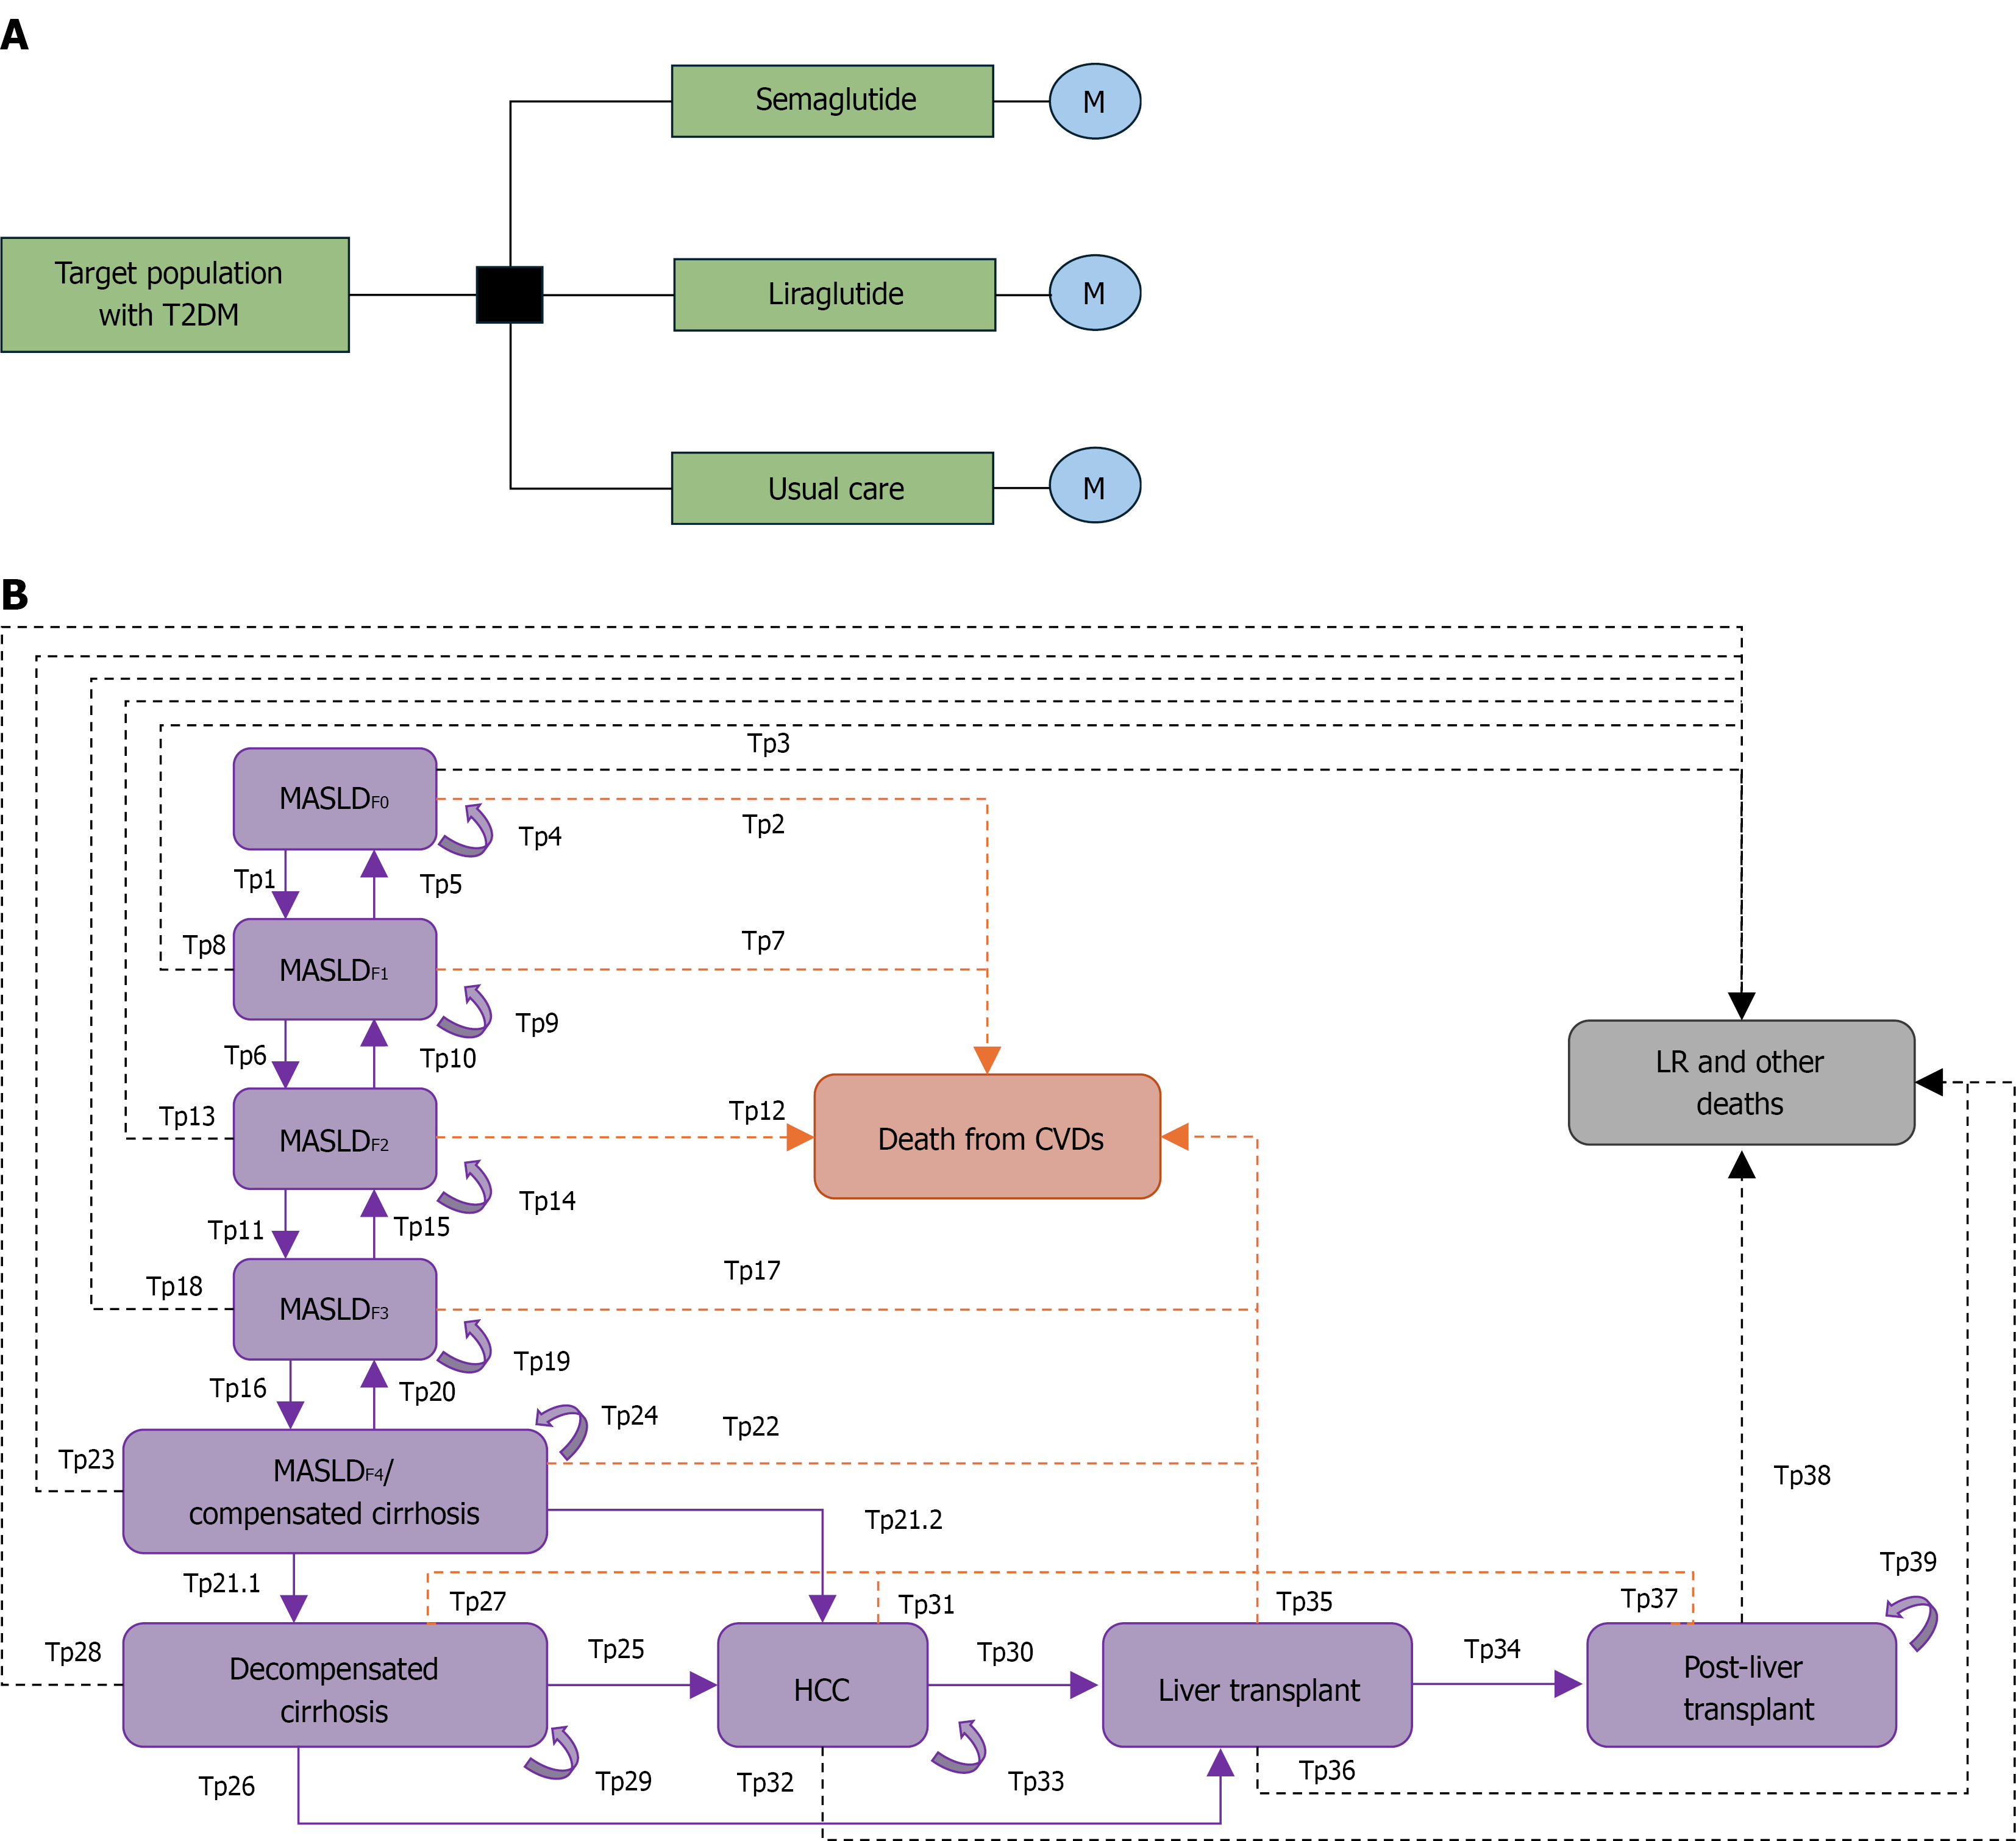
Figure 1 Decision tree and Markov model.
A: Decision tree; B: Markov model. In the decision tree, the square represents a decision node. The Markov model describes disease progression in metabolic dysfunction-associated steatotic liver disease. Arrows indicate possible patient transitions through the model. Solid arrows represent transition probabilities, whereas dashed arrows represent transitions to death states: Orange arrows indicate deaths from cardiovascular diseases, and black arrows indicate liver-related and other deaths. CVD: Cardiovascular disease; F: Fibrosis stage; HCC: Hepatocellular carcinoma; LR: Liver-related; MASLD: Metabolic dysfunction-associated steatotic liver disease; T2DM: Type 2 diabetes mellitus; Tp: Transition probability.
- Citation: Limwongse S, Chatpattanasiri P, Phuphuang P, Tungthaweethong K, Sutheerayongprasert K, Aunprom-Me W, Kositamongkol C, Phisalprapa P. Cost-utility analysis of glucagon-like peptide-1 receptor agonists for type 2 diabetes mellitus and metabolic dysfunction-associated steatotic liver disease in Thailand. World J Hepatol 2026; 18(10): 123353
- URL: https://www.wjgnet.com/1948-5182/full/v18/i10/123353.htm
- DOI: https://dx.doi.org/10.4254/wjh.123353