















Copyright: ©Author(s) 2026.
World J Hepatol. Oct 27, 2026; 18(10): 123267
Published online Oct 27, 2026. doi: 10.4254/wjh.123267
Published online Oct 27, 2026. doi: 10.4254/wjh.123267
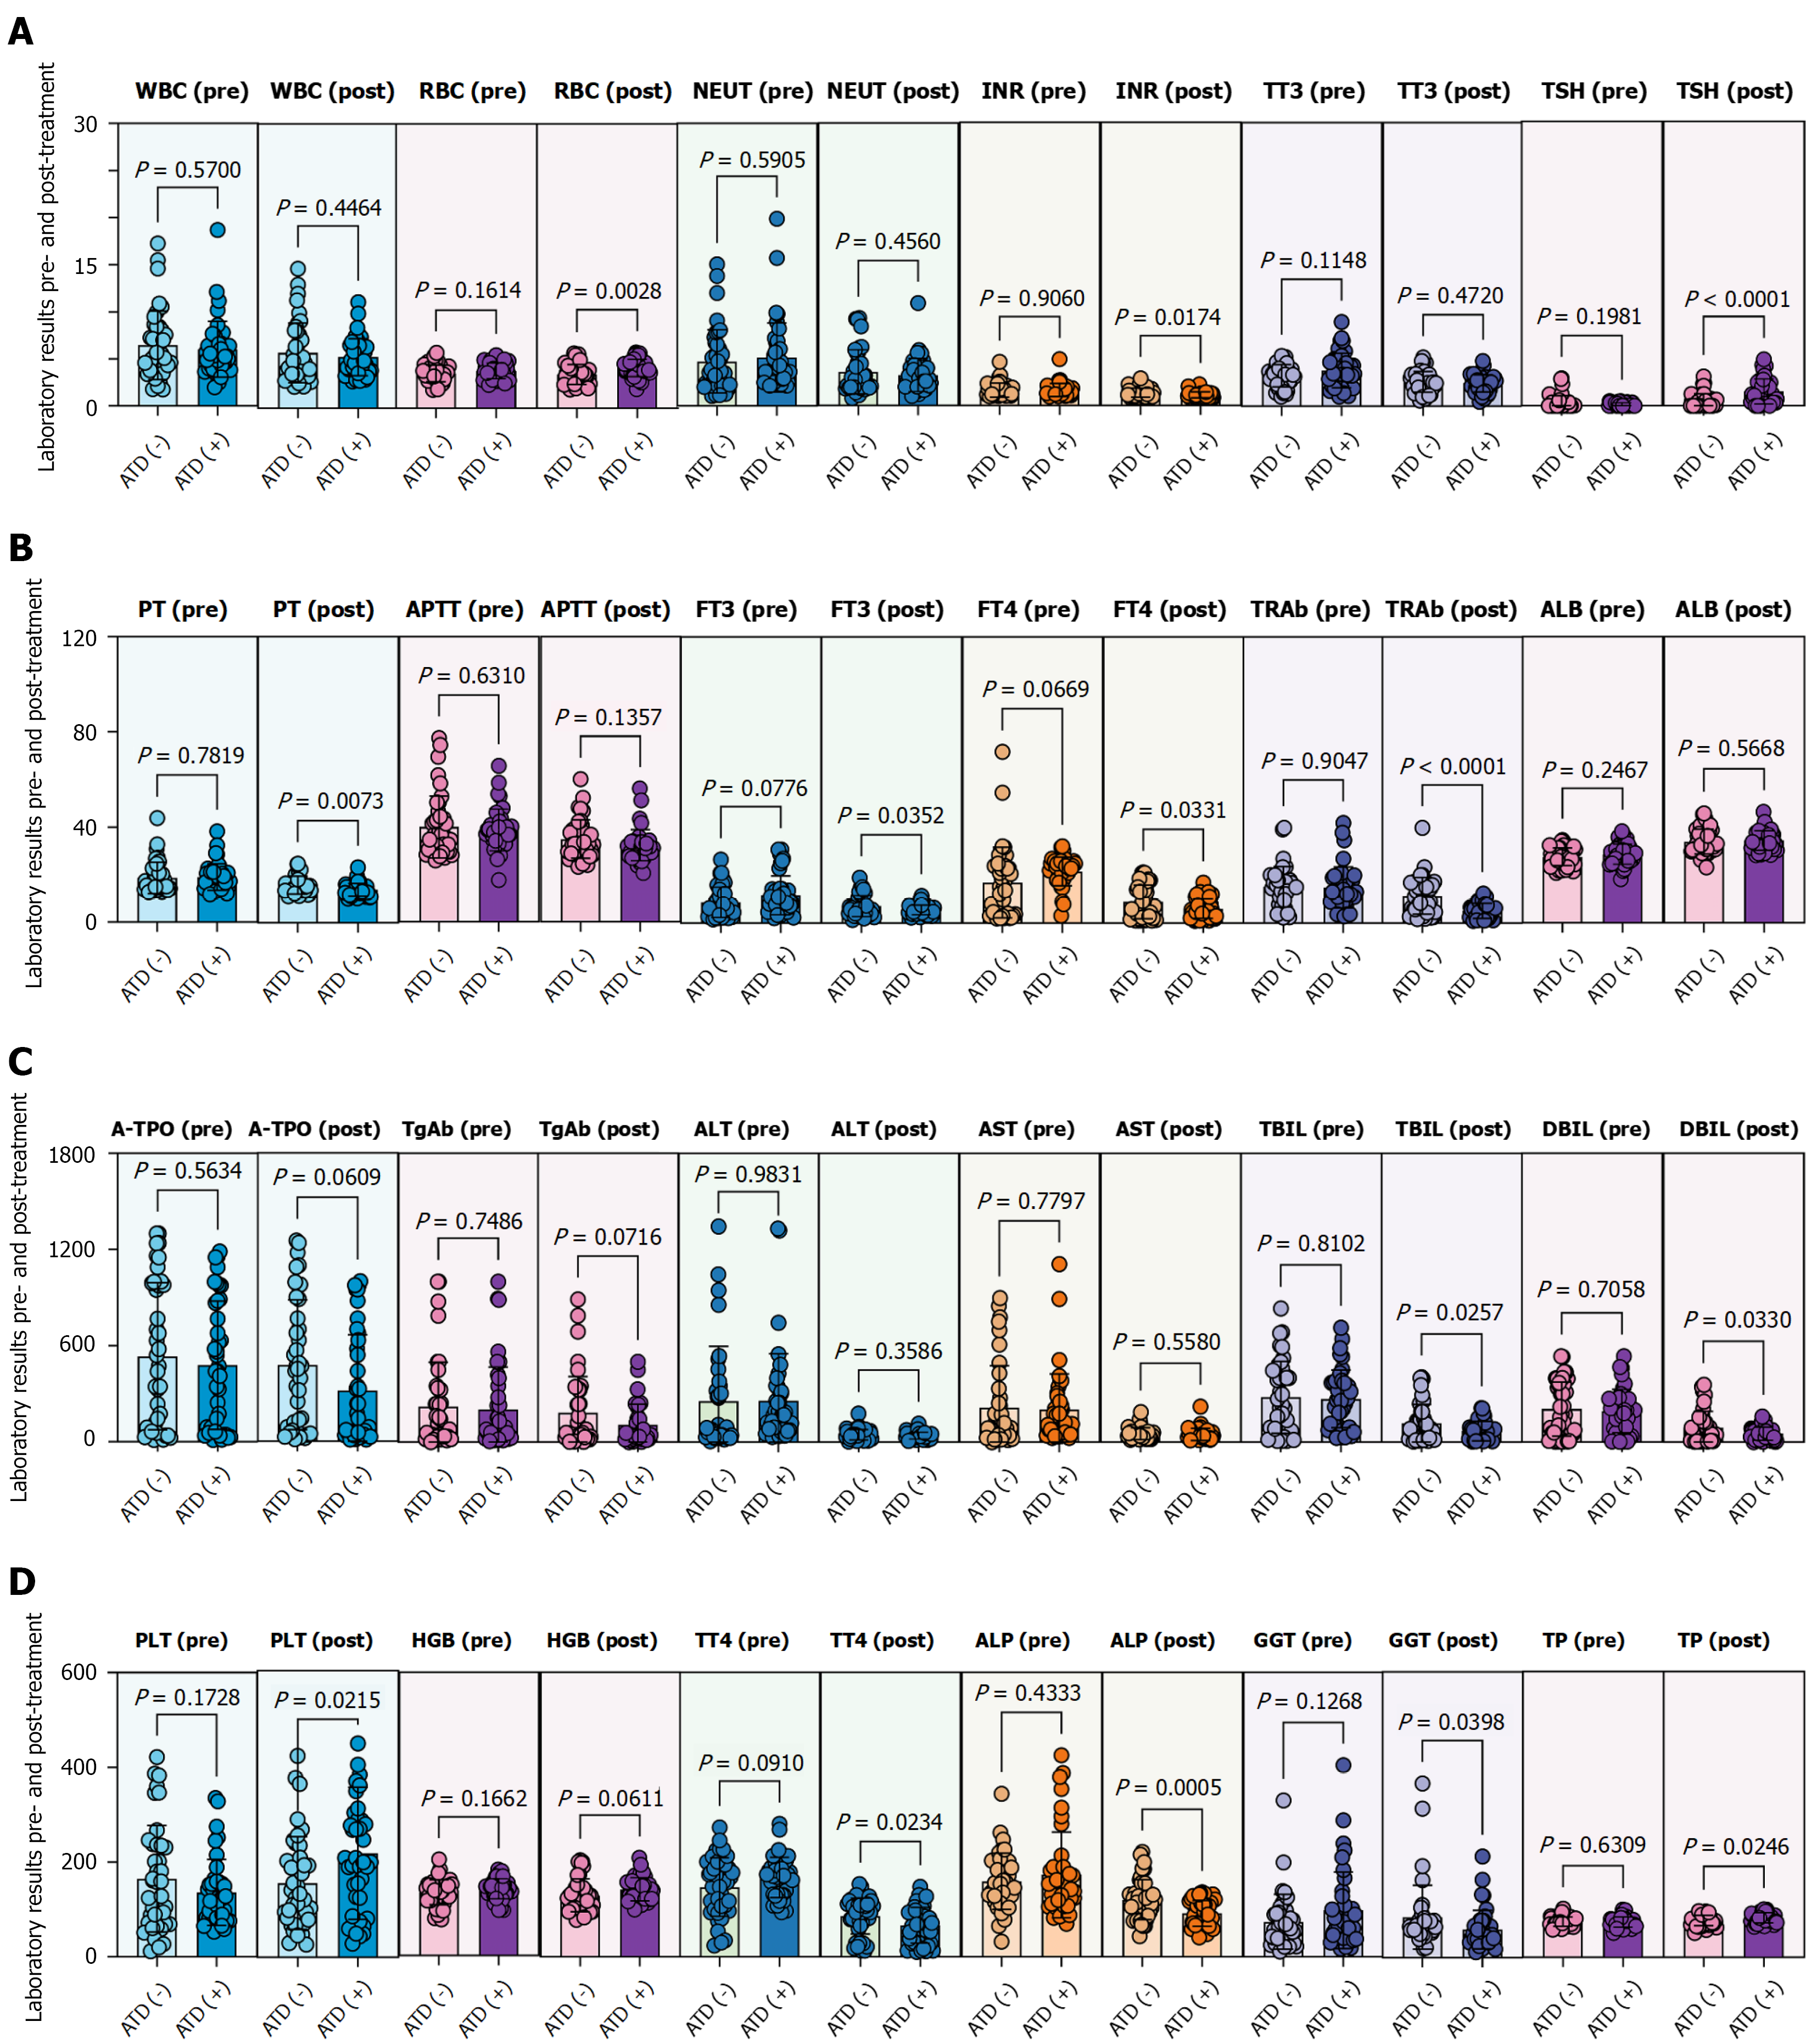
Figure 3 Matrix of P values for comparisons of clinical parameters between antithyroid drug-treated and non-antithyroid drug groups before and after treatment.
A: It compares the differences in white blood cell, red blood cell, neutrophil, international normalized ratio, total triiodothyronine, and thyroid stimulating hormone between the antithyroid drug (ATD) treatment group [ATD (+)] and the non-ATD treatment group [ATD (-)] before and after treatment. Before treatment, there were no statistically significant differences between the two groups for any of these indicators (P > 0.05). After treatment, the differences in red blood cell, international normalized ratio, and thyroid stimulating hormone between the two groups were statistically significant (P < 0.05); B: It compares the differences in prothrombin time, activated partial thromboplastin time, free triiodothyronine, free thyroxine, thyrotropin receptor antibody, and albumin between the ATD treatment group [ATD (+)] and the non-ATD treatment group [ATD (-)] before and after treatment. Before treatment, none of the differences between the two groups were statistically significant for any of the indicators (P > 0.05). After treatment, the differences in prothrombin time, free triiodothyronine, free thyroxine, and thyrotropin receptor antibody between the two groups were statistically significant (P < 0.05); C: It compares the differences in thyroid peroxidase antibody, thyroglobulin antibody, alanine aminotransferase, aspartate aminotransferase, total bilirubin, and direct bilirubin between the ATD treatment group [ATD (+)] and the non-ATD treatment group [ATD (-)] before and after treatment. Before treatment, there were no statistically significant differences between the two groups for any of these indicators (P > 0.05). After treatment, the differences in total bilirubin and direct bilirubin between the two groups were statistically significant (P < 0.05); D: It compares the differences in platelet, hemoglobin, total thyroxine, alkaline phosphatase, γ-glutamyl transferase, and total protein between the ATD treatment group [ATD (+)] and the non-ATD treatment group [ATD (-)] before and after treatment. Before treatment, there were no statistically significant differences between the two groups for any of these indicators (P > 0.05). After treatment, the differences in platelet, total thyroxine, alkaline phosphatase, γ-glutamyl transferase, and total protein between the two groups were statistically significant (P < 0.05). Rows and columns represent laboratory indicators measured at pre-treatment and post-treatment time points in patients stratified by ATD use: (1) ATD (+) indicates patients receiving ATD therapy; and (2) ATD (-) indicates patients not receiving ATD therapy. Each cell contains the P value from a statistical test (e.g., paired t-test, Wilcoxon signed-rank test, or correlation analysis) assessing the relationship or difference between the corresponding row and column parameters. P values less than 0.05 are considered statistically significant. WBC: White blood cell; RBC: Red blood cell; ATD: Antithyroid drug; NEUT: Neutrophil; ALT: Alanine aminotransferase; AST: Aspartate aminotransferase; ALB: Albumin; TP: Total protein; TBIL: Total bilirubin; DBIL: Direct bilirubin; ALP: Alkaline phosphatase; GGT: Γ-glutamyl transferase; FT3: Free triiodothyronine; FT4: Free thyroxine; TT3: Total triiodothyronine; TT4: Total thyroxine; TRAb: Thyrotropin receptor antibody; A-TPO: Thyroid peroxidase antibody; TgAb: Thyroglobulin antibody; PT: Prothrombin time; APTT: Activated partial thromboplastin time; INR: International normalized ratio; TSH: Thyroid stimulating hormone; PLT: Platelet; HGB: Hemoglobin; Pre: Pre-treatment; Post: Post-treatment.
- Citation: Yu W, Dai ZS, Li YH, Li MP, Li J, Jiao KX, Ma J, Li Y. Proactive antithyroid therapy improves survival in hyperthyroidism-induced liver injury: A real-world cohort study. World J Hepatol 2026; 18(10): 123267
- URL: https://www.wjgnet.com/1948-5182/full/v18/i10/123267.htm
- DOI: https://dx.doi.org/10.4254/wjh.123267