
















Copyright: ©Author(s) 2026.
World J Hepatol. Oct 27, 2026; 18(10): 121142
Published online Oct 27, 2026. doi: 10.4254/wjh.121142
Published online Oct 27, 2026. doi: 10.4254/wjh.121142
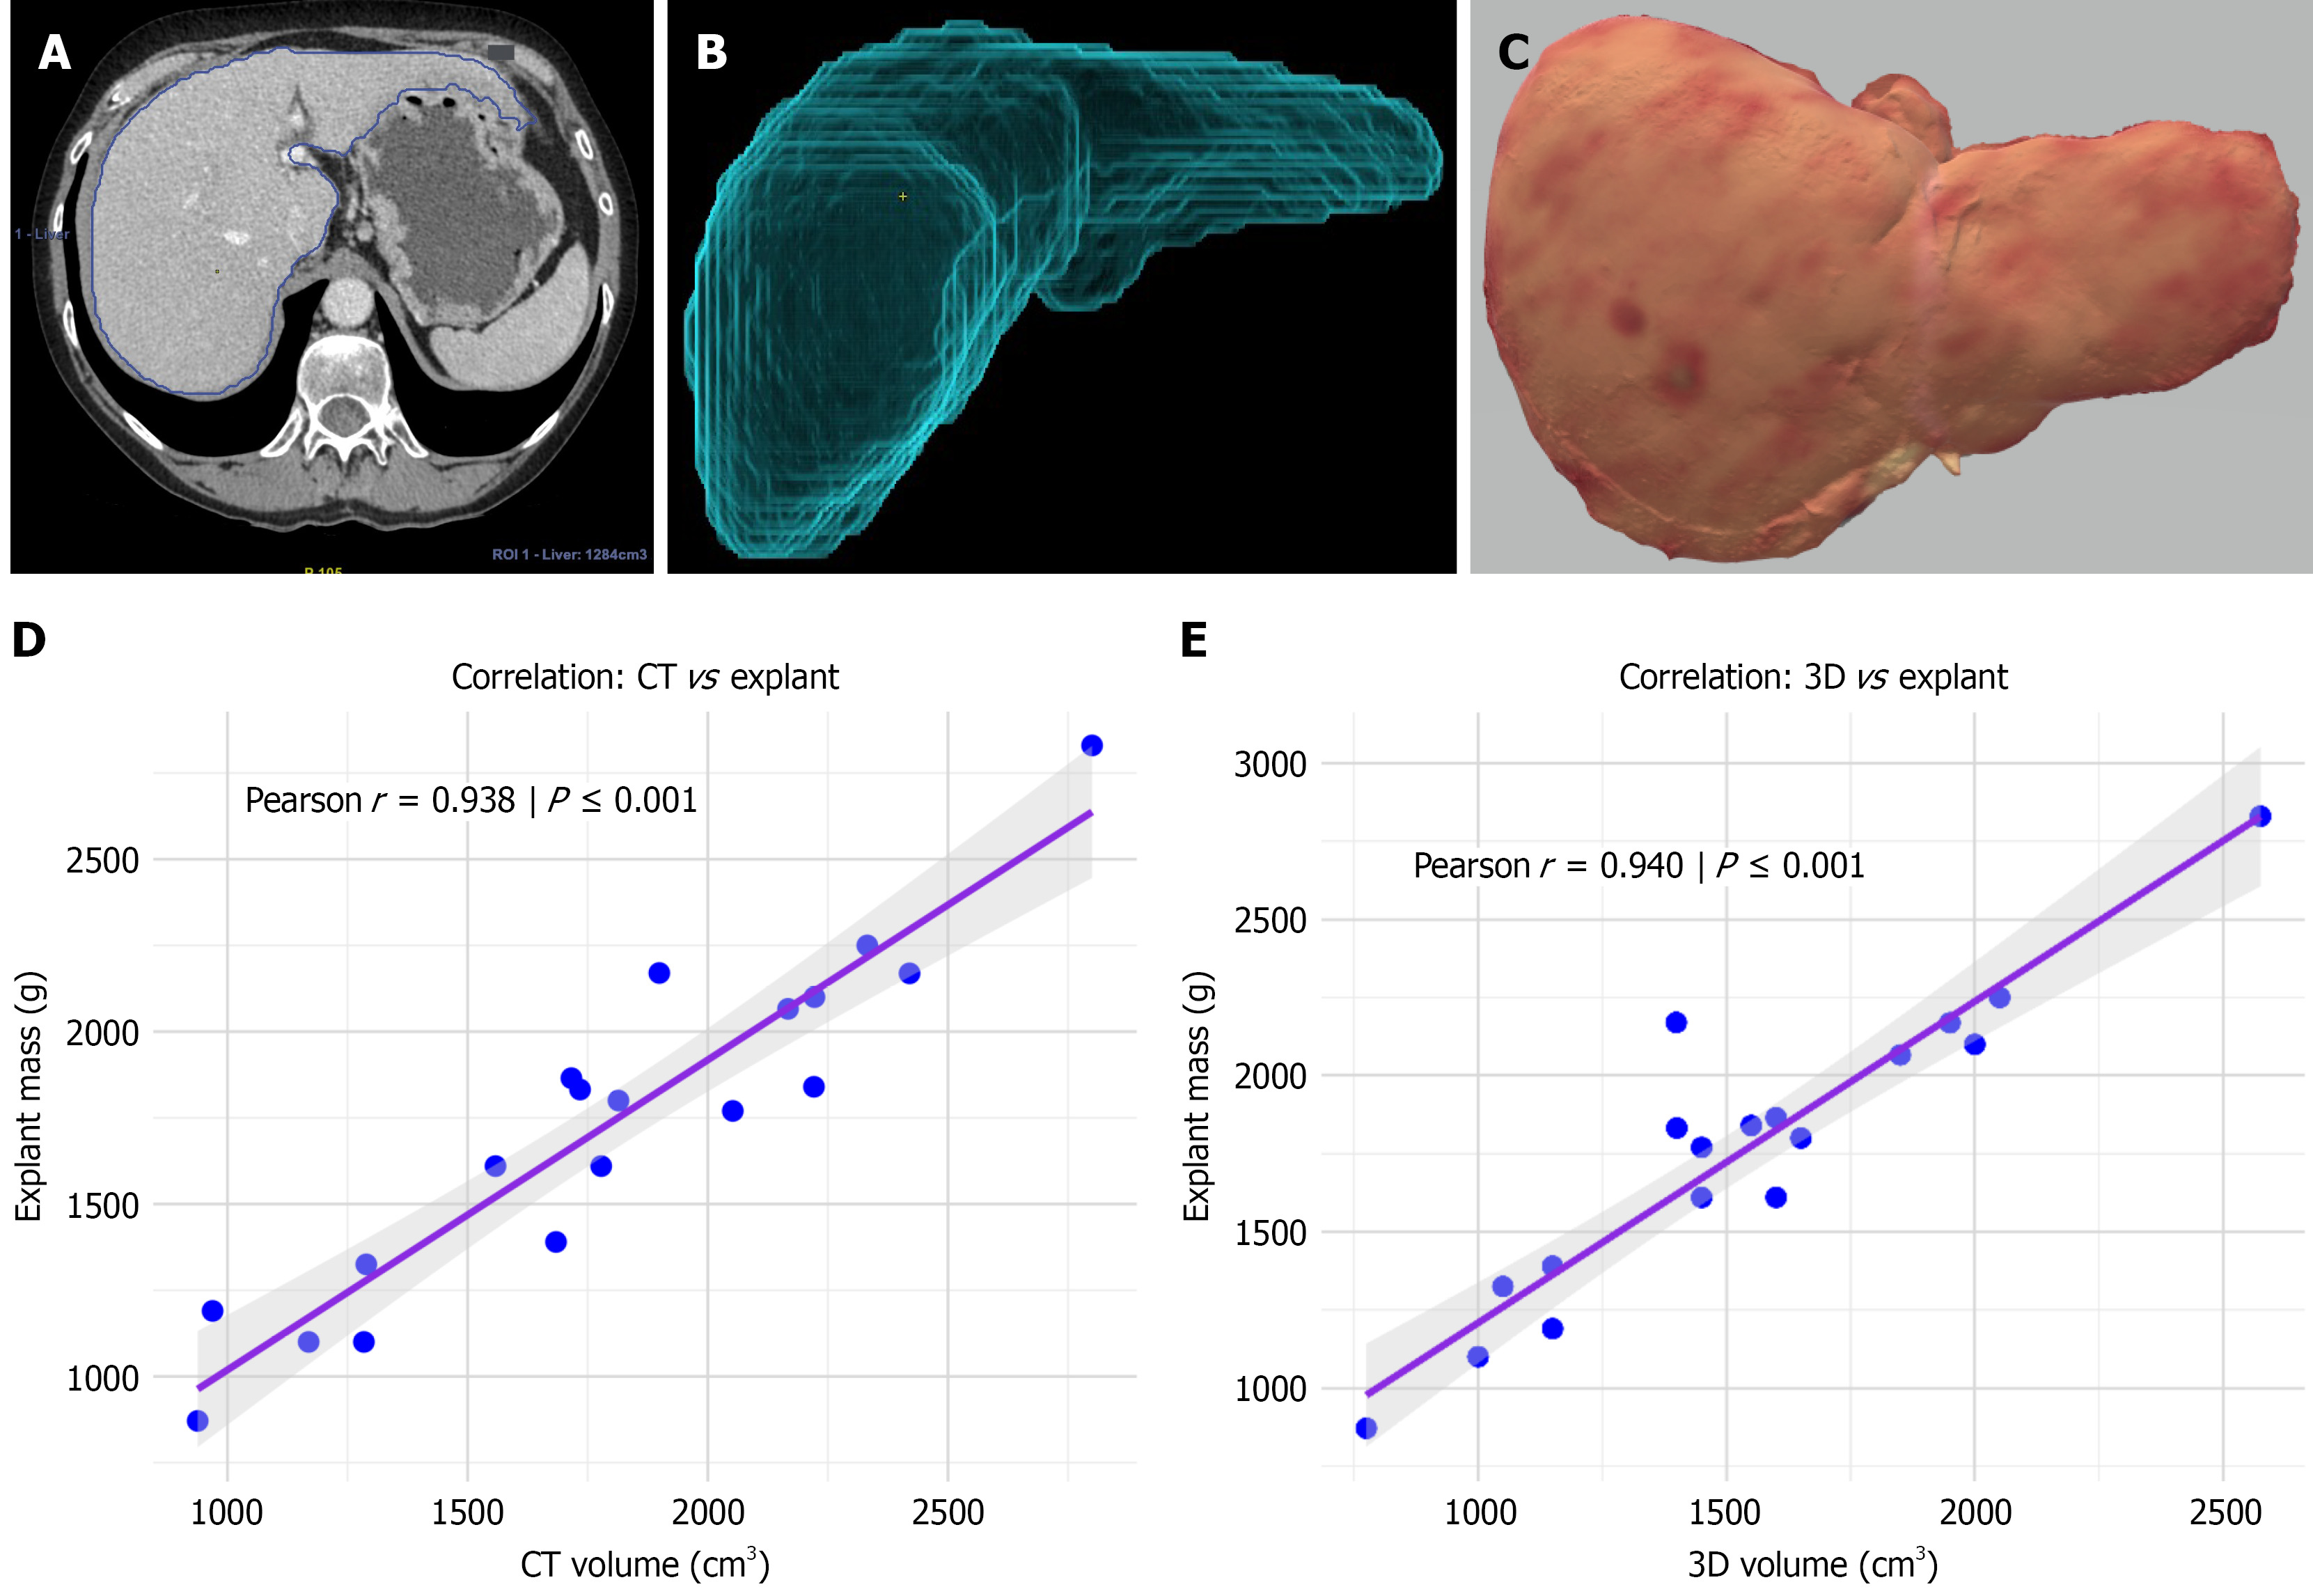
Figure 1 Comparison of computed tomography volumetry, three-dimensional reconstruction workflow, and corresponding correlation analyses.
A: Representative axial computed tomography (CT) image; B: Three-dimensional (3D) liver model reconstructed from CT imaging using semi-automated segmentation and volumetric analysis (AW Server 3.2 EXT 4.0, GE Healthcare; Hepatic VCAR application); C: 3D reconstructed explant model generated from Polycam (photogrammetry-based scanning application) and refined in Blender, representing the surface-based anatomical morphology of the liver specimen; D: Correlation between 3D surface-derived volumetry and liver explant mass; E: Correlation between CT volumetry and explant liver mass. Values are expressed in grams (g) for mass and cubic centimeters (cm3) for volumetric measurements. CT: Computed tomography; 3D: Three-dimensional.
- Citation: Jaya LOI, Rykowski P, Bartkowiak M, Kruk E, Chodurska M, Lewandowski Z, Krasnodębski M, Grąt M. Computed tomography volumetry vs three-dimensional surface scanning for liver graft size estimation using explant liver mass. World J Hepatol 2026; 18(10): 121142
- URL: https://www.wjgnet.com/1948-5182/full/v18/i10/121142.htm
- DOI: https://dx.doi.org/10.4254/wjh.121142