Copyright
©The Author(s) 2025.
World J Hepatol. Aug 27, 2025; 17(8): 109796
Published online Aug 27, 2025. doi: 10.4254/wjh.v17.i8.109796
Published online Aug 27, 2025. doi: 10.4254/wjh.v17.i8.109796
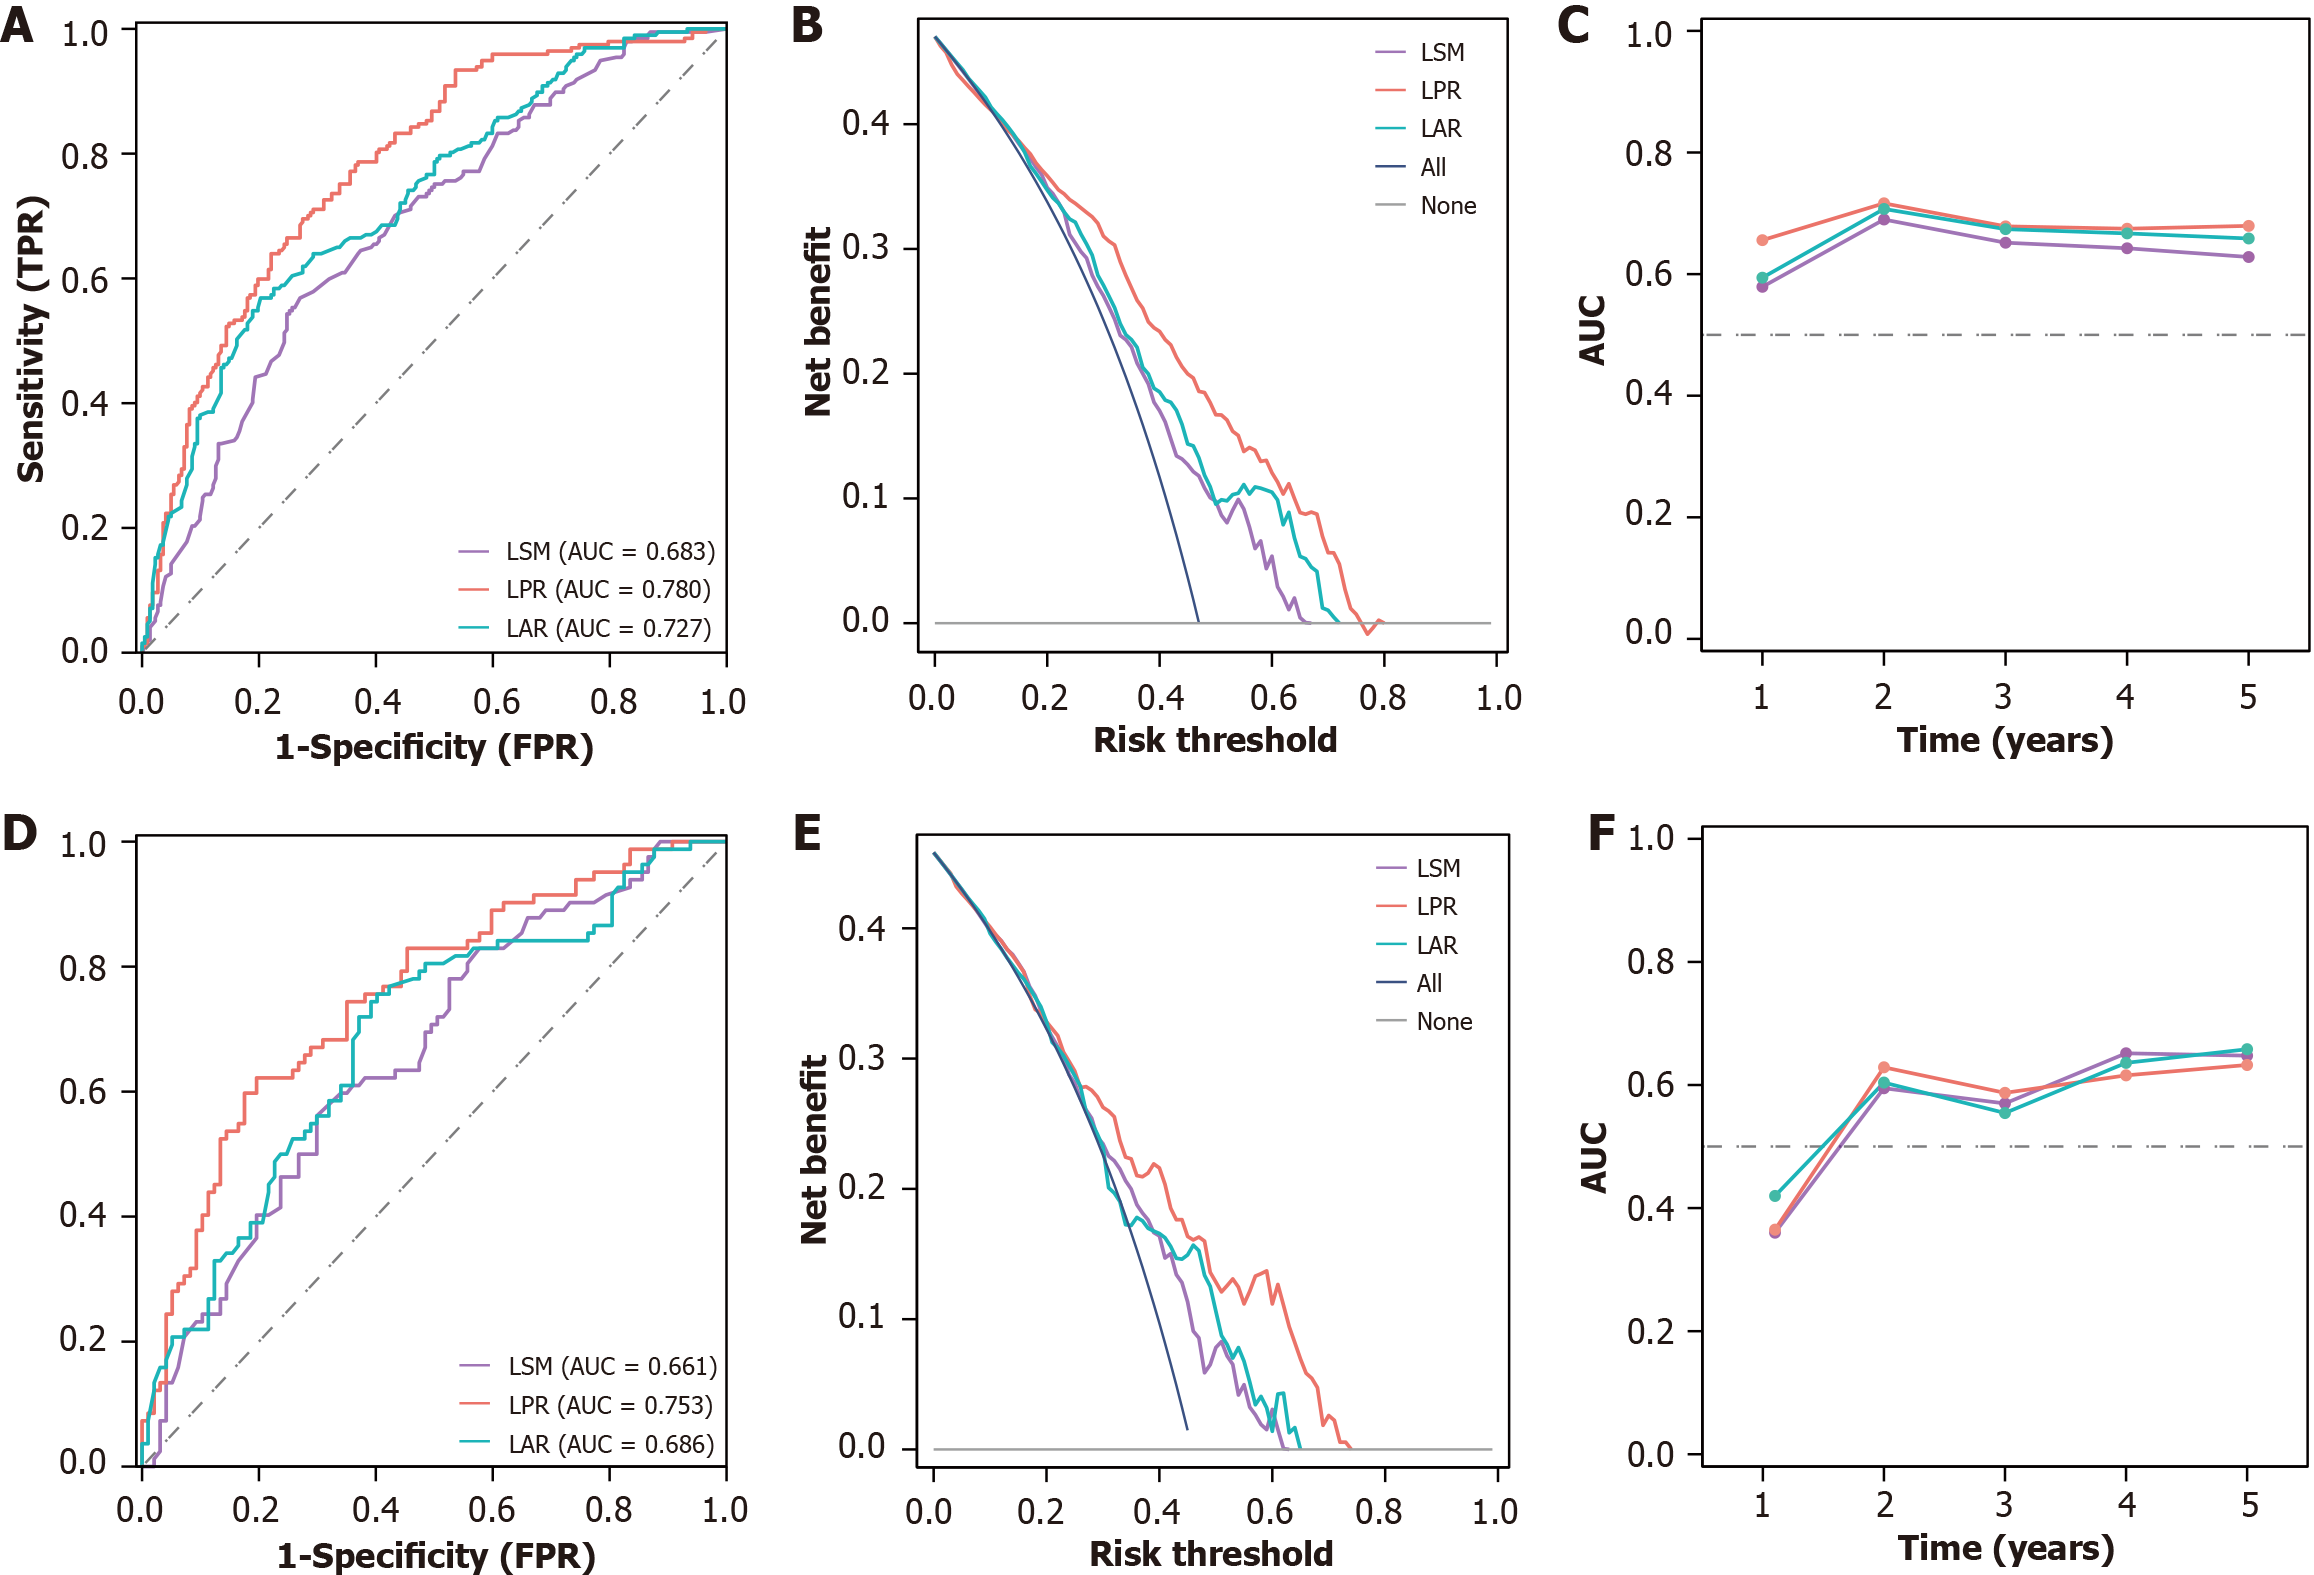
Figure 1 Performance evaluation of liver stiffness measurement and its composite indices in predicting liver-related events.
A: Receiver operating characteristic (ROC) of liver stiffness measurement (LSM), LSM-platelet ratio (LPR), and LSM-albumin ratio (LAR) models in the training cohort; B: Decision curve analysis of LSM, LPR, and LAR models in the training cohort; C: Time-dependent area under the curve (AUC) analysis of LSM, LPR, and LAR models in the training cohort; D: ROC curve of LSM, LPR, and LAR models in the validation cohort; E: Decision curve analysis of LSM, LPR, and LAR models in the validation cohort; F: Time-dependent AUC analysis of LSM, LPR, and LAR models in the validation cohort.
- Citation: Li YQ, Li YQ, Li JZ, Zhu BB, Lu Y, Feng Y, Wang XB. Assessment of liver stiffness measurement-related markers in predicting liver-related events in viral cirrhosis with clinically significant portal hypertension. World J Hepatol 2025; 17(8): 109796
- URL: https://www.wjgnet.com/1948-5182/full/v17/i8/109796.htm
- DOI: https://dx.doi.org/10.4254/wjh.v17.i8.109796


