Basic Study
Copyright ©The Author(s) 2025.
World J Hepatol. Aug 27, 2025; 17(8): 107456
Published online Aug 27, 2025. doi: 10.4254/wjh.v17.i8.107456
Figure 1
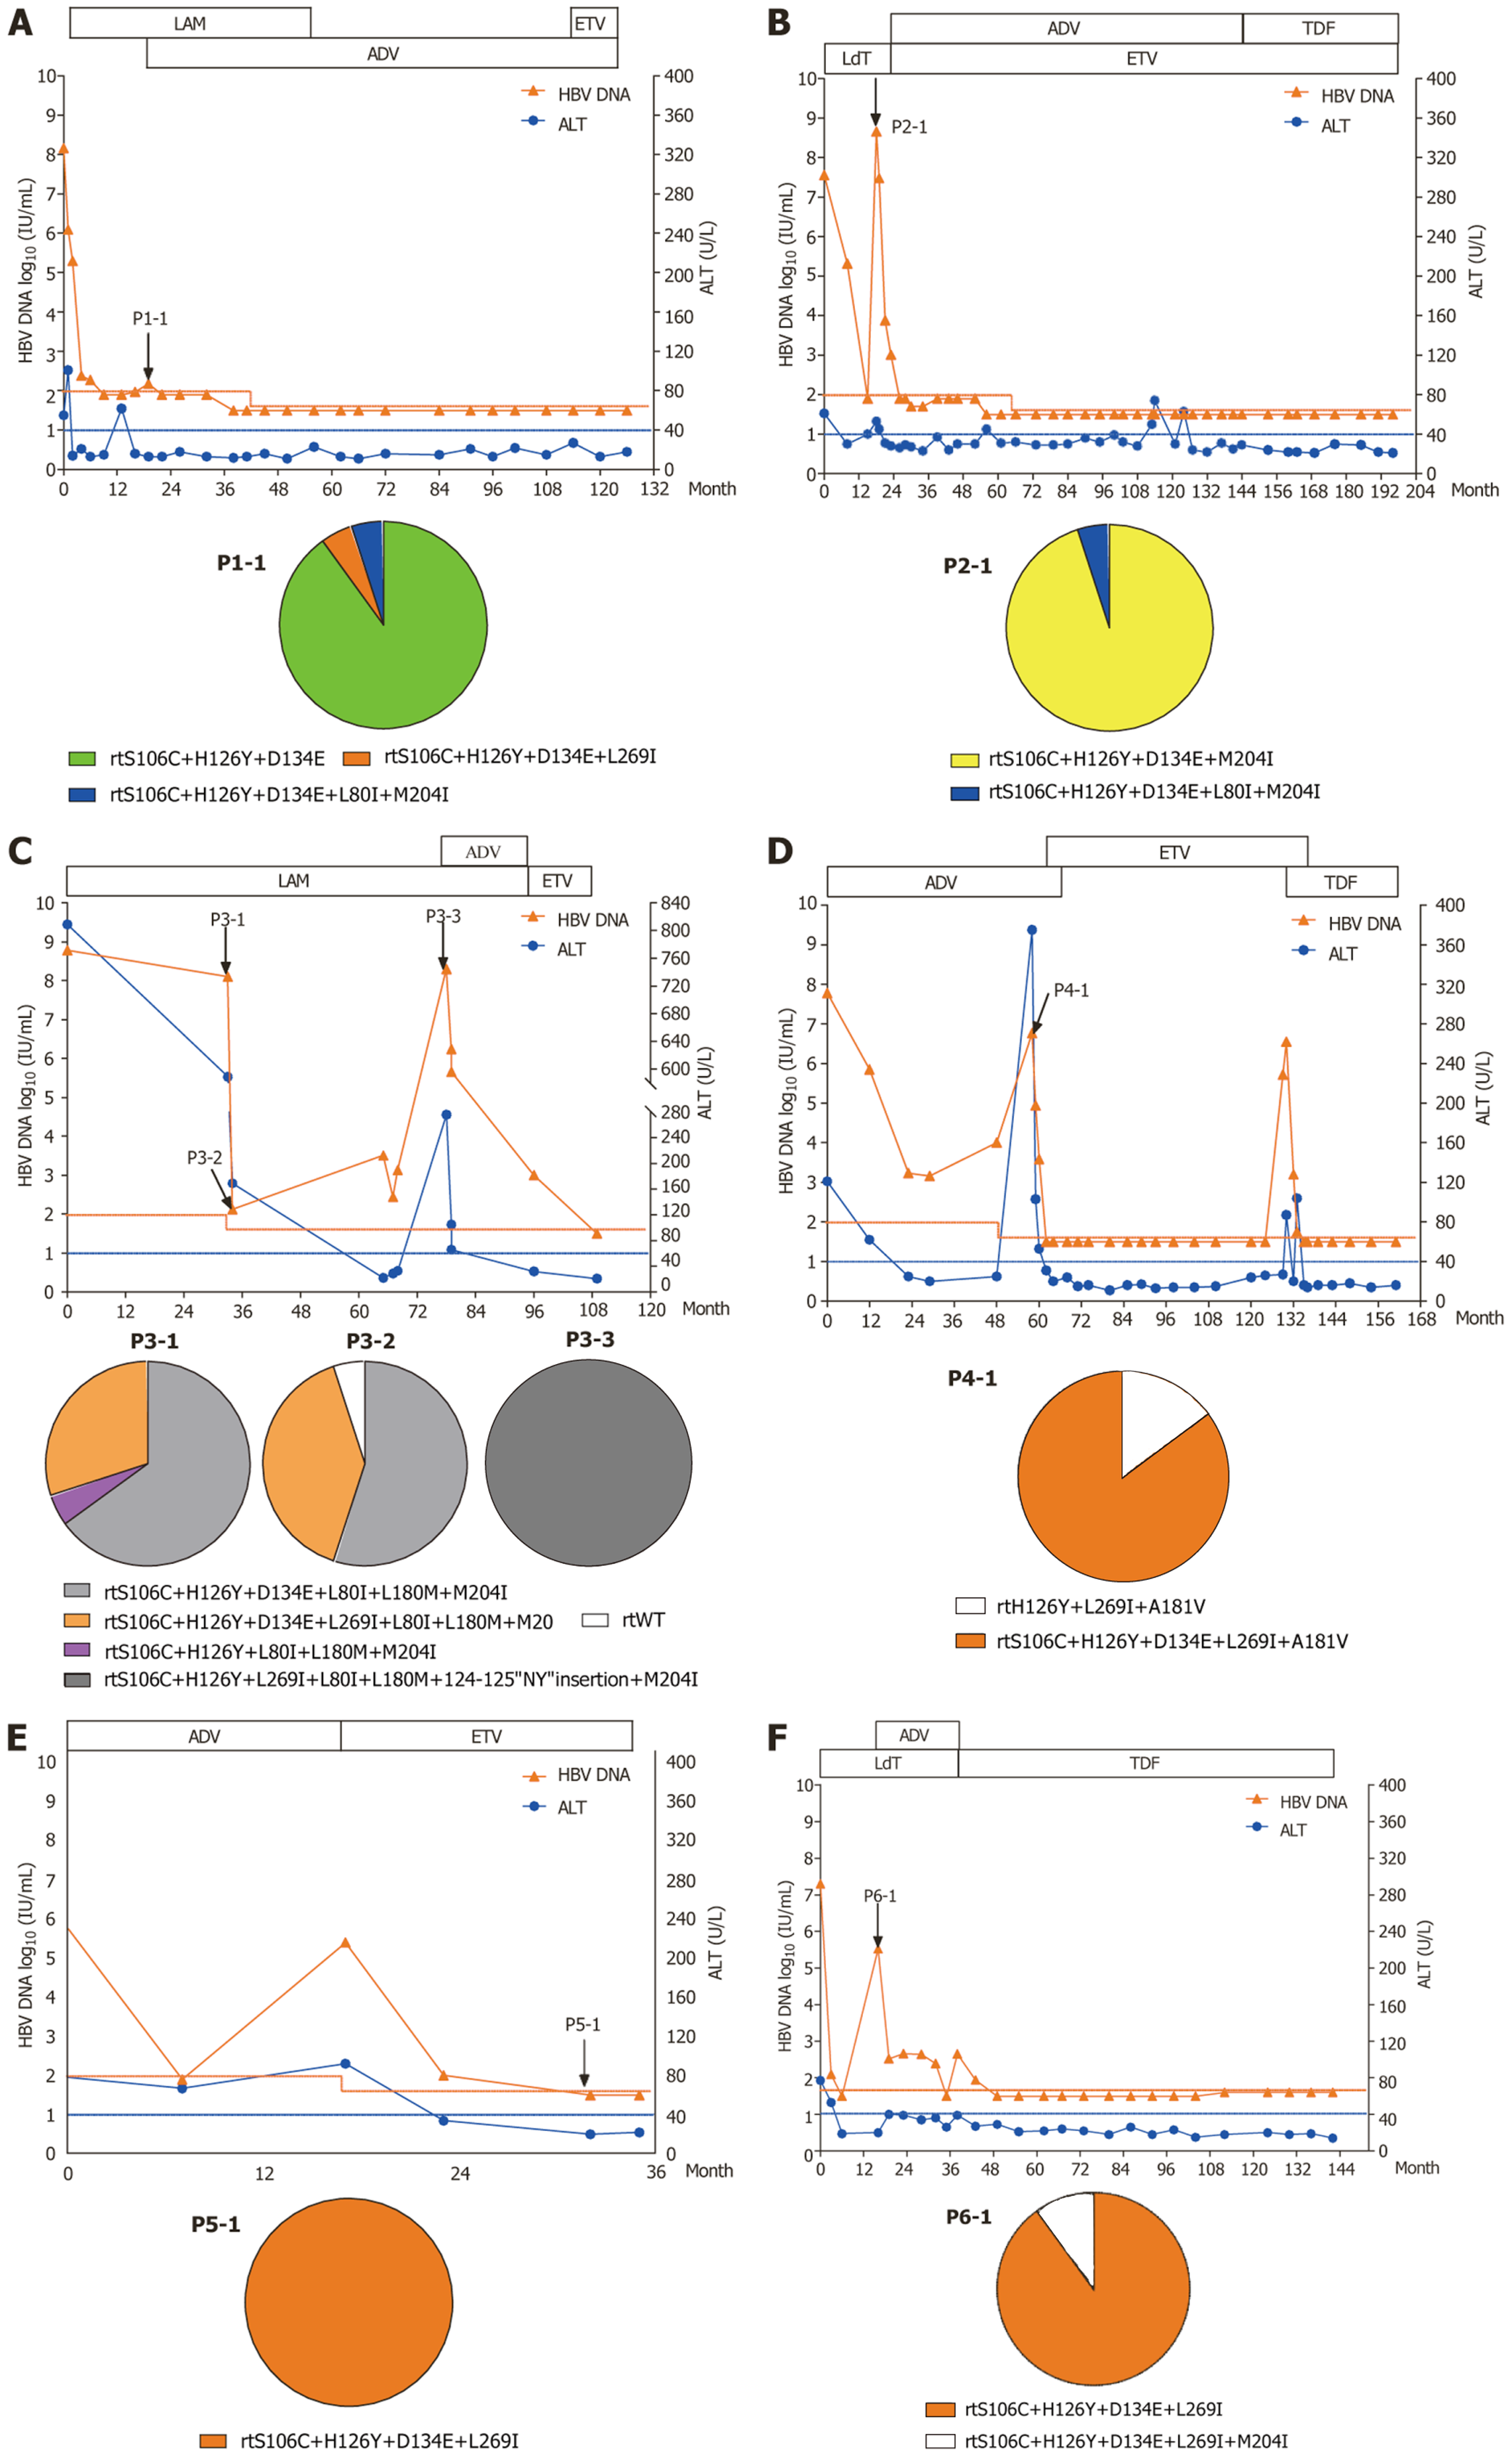
Figure 1 The evolution of drug-resistant hepatitis B virus mutants and clinical responses during the antiviral therapy of six representative patients. The duration (months) of therapy is indicated by bars above the graph and serum samples from the patient are indicated by the time-points of sampling shown by arrows on the graph. Two dashed lines show the lower limit of detection of hepatitis B virus (HBV) DNA (100 IU/mL) and normal alanine aminotransferase (ALT) level (40 U/L). Proportions of wild-type and mutant HBV strains in the viral reverse-transcriptase of each sample are depicted by a series of pie charts. P1-1, serum sample 1 from patient 1; P2-1, serum sample 1 from patient 2; P3-1, serum sample 1 from patient 3; P3-2, serum sample 2 from patient 3; P3-3, serum sample 3 from patient 3; P4-1, serum sample 1 from patient 4; P5-1, serum sample 1 from patient 5; P6-1, serum sample 1 from patient 6. A: The dynamic changes in serum HBV DNA and ALT levels are shown along with the antiviral therapy for patient 1; B: The dynamic changes in serum HBV DNA and ALT levels are shown along with the antiviral therapy for patient 2; C: The dynamic changes in serum HBV DNA and ALT levels are shown along with the antiviral therapy for patient 3; D: The dynamic changes in serum HBV DNA and ALT levels are shown along with the antiviral therapy for patient 4; E: The dynamic changes in serum HBV DNA and ALT levels are shown along with the antiviral therapy for patient 5; F: The dynamic changes in serum HBV DNA and ALT levels are shown along with the antiviral therapy for patient 6. LAM: Lamivudine; ADV: Adefovir dipivoxil; ETV: Entecavir; TDF: Tenofovir disoproxil fumarate.