Copyright
©The Author(s) 2025.
World J Hepatol. Jul 27, 2025; 17(7): 109067
Published online Jul 27, 2025. doi: 10.4254/wjh.v17.i7.109067
Published online Jul 27, 2025. doi: 10.4254/wjh.v17.i7.109067
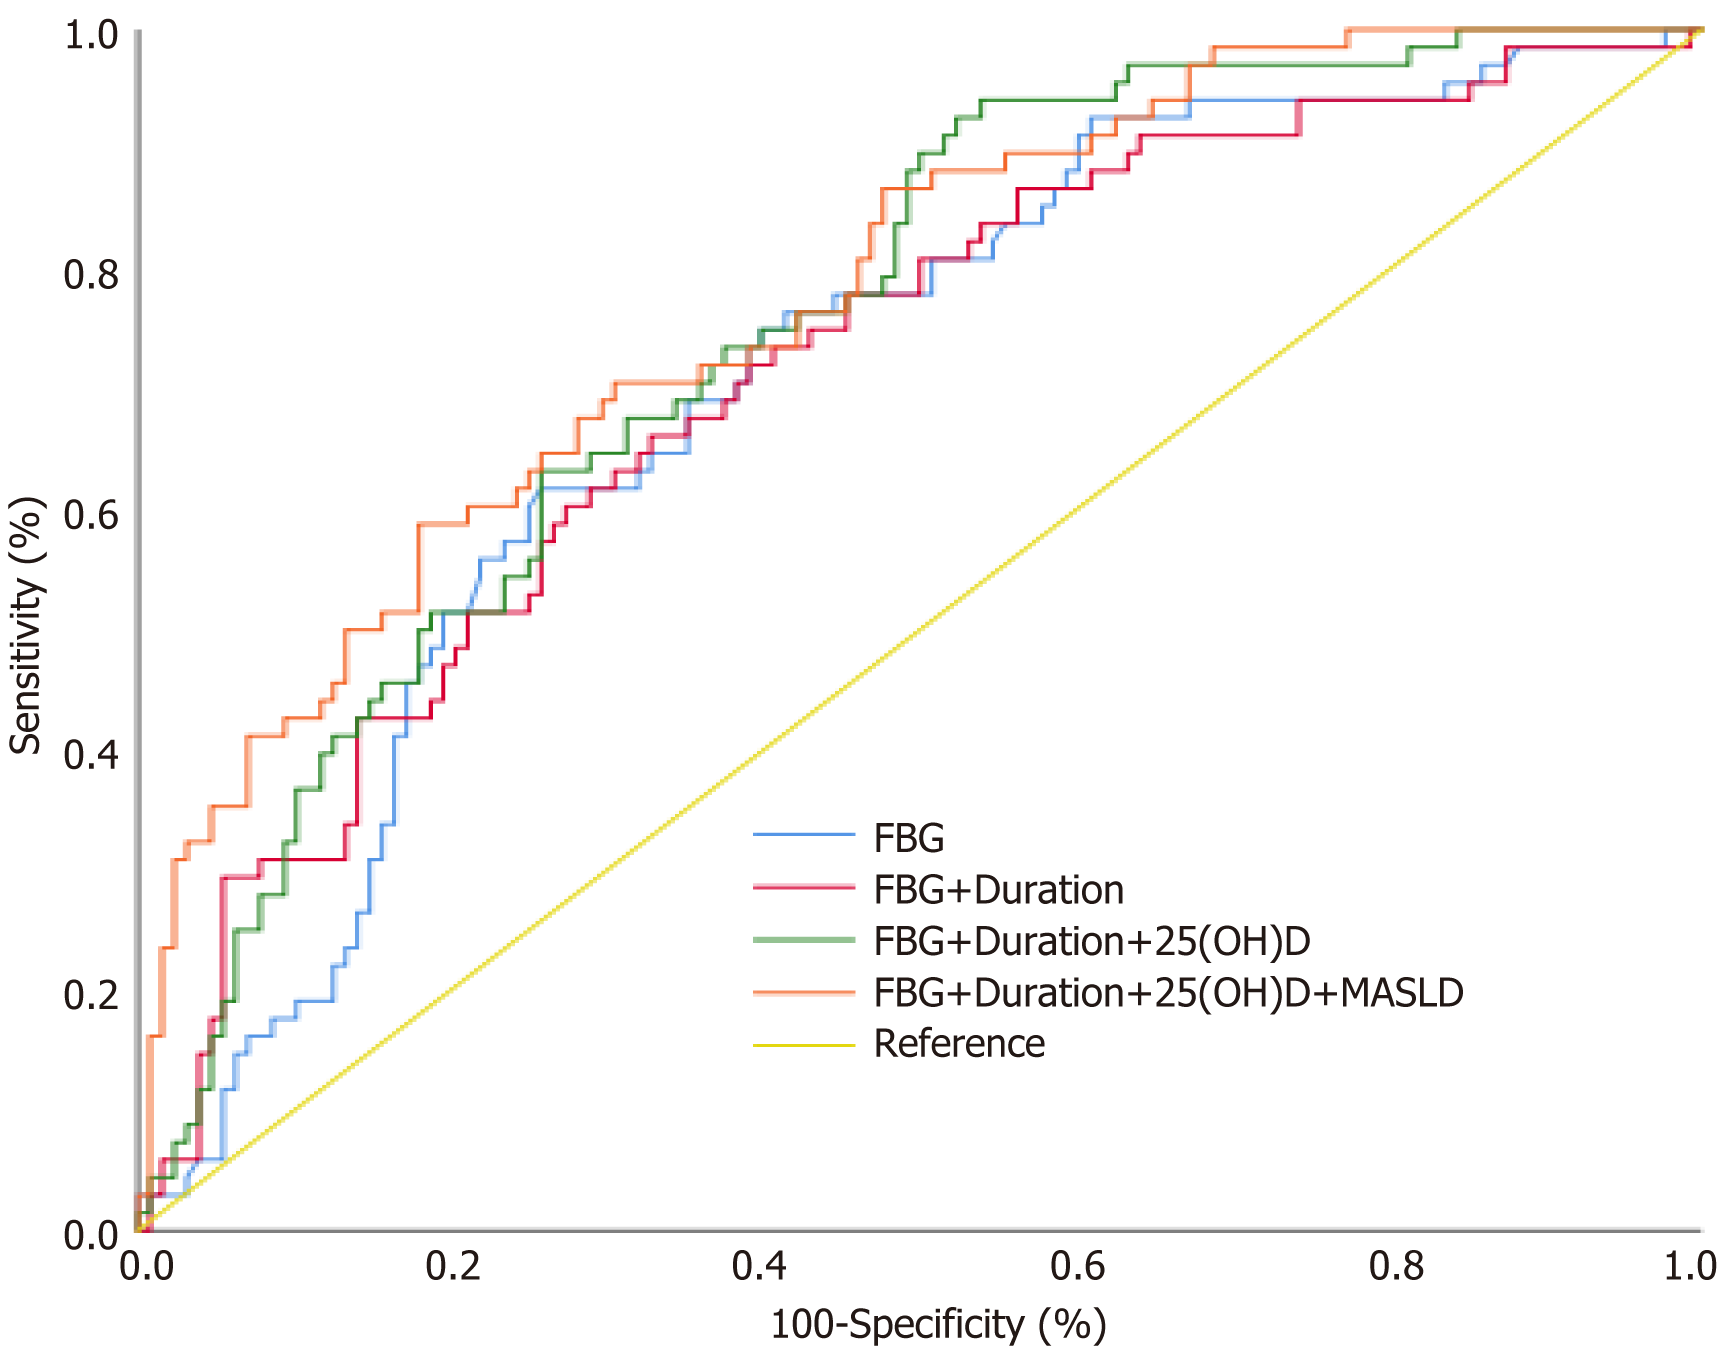
Figure 1 Receiver operating characteristic curves comparing the potential of different variables to predict diabetic gastric motility disorders.
Model 1 (Blue), fasting blood glucose (FBG), area under the curve (AUC) is 0.708; model 2 (Red), FBG+Duration, AUC is 0.715; model 3 (Green), FBG+Duration+25-hydroxyvitamin D [25(OH)D], AUC is 0.750; model 4 (Orange), FBG+Duration+25(OH)D+ metabolic dysfunction-associated steatotic liver disease, AUC is 0.777. FBG: Fasting blood glucose; AUC: Area under the curve; MASLD: Metabolic dysfunction-associated steatotic liver disease; 25(OH)D: 25-hydroxyvitamin D.
- Citation: Wang XX, Yan C, Wang SJ, Zhu H, Cao CC, Wu L, Wang S, Hu J, Zhang HH. Analysis of gastric electrical rhythm in patients with metabolic dysfunction-associated steatotic liver disease and type 2 diabetes mellitus. World J Hepatol 2025; 17(7): 109067
- URL: https://www.wjgnet.com/1948-5182/full/v17/i7/109067.htm
- DOI: https://dx.doi.org/10.4254/wjh.v17.i7.109067


