Copyright
©The Author(s) 2025.
World J Hepatol. Jul 27, 2025; 17(7): 107666
Published online Jul 27, 2025. doi: 10.4254/wjh.v17.i7.107666
Published online Jul 27, 2025. doi: 10.4254/wjh.v17.i7.107666
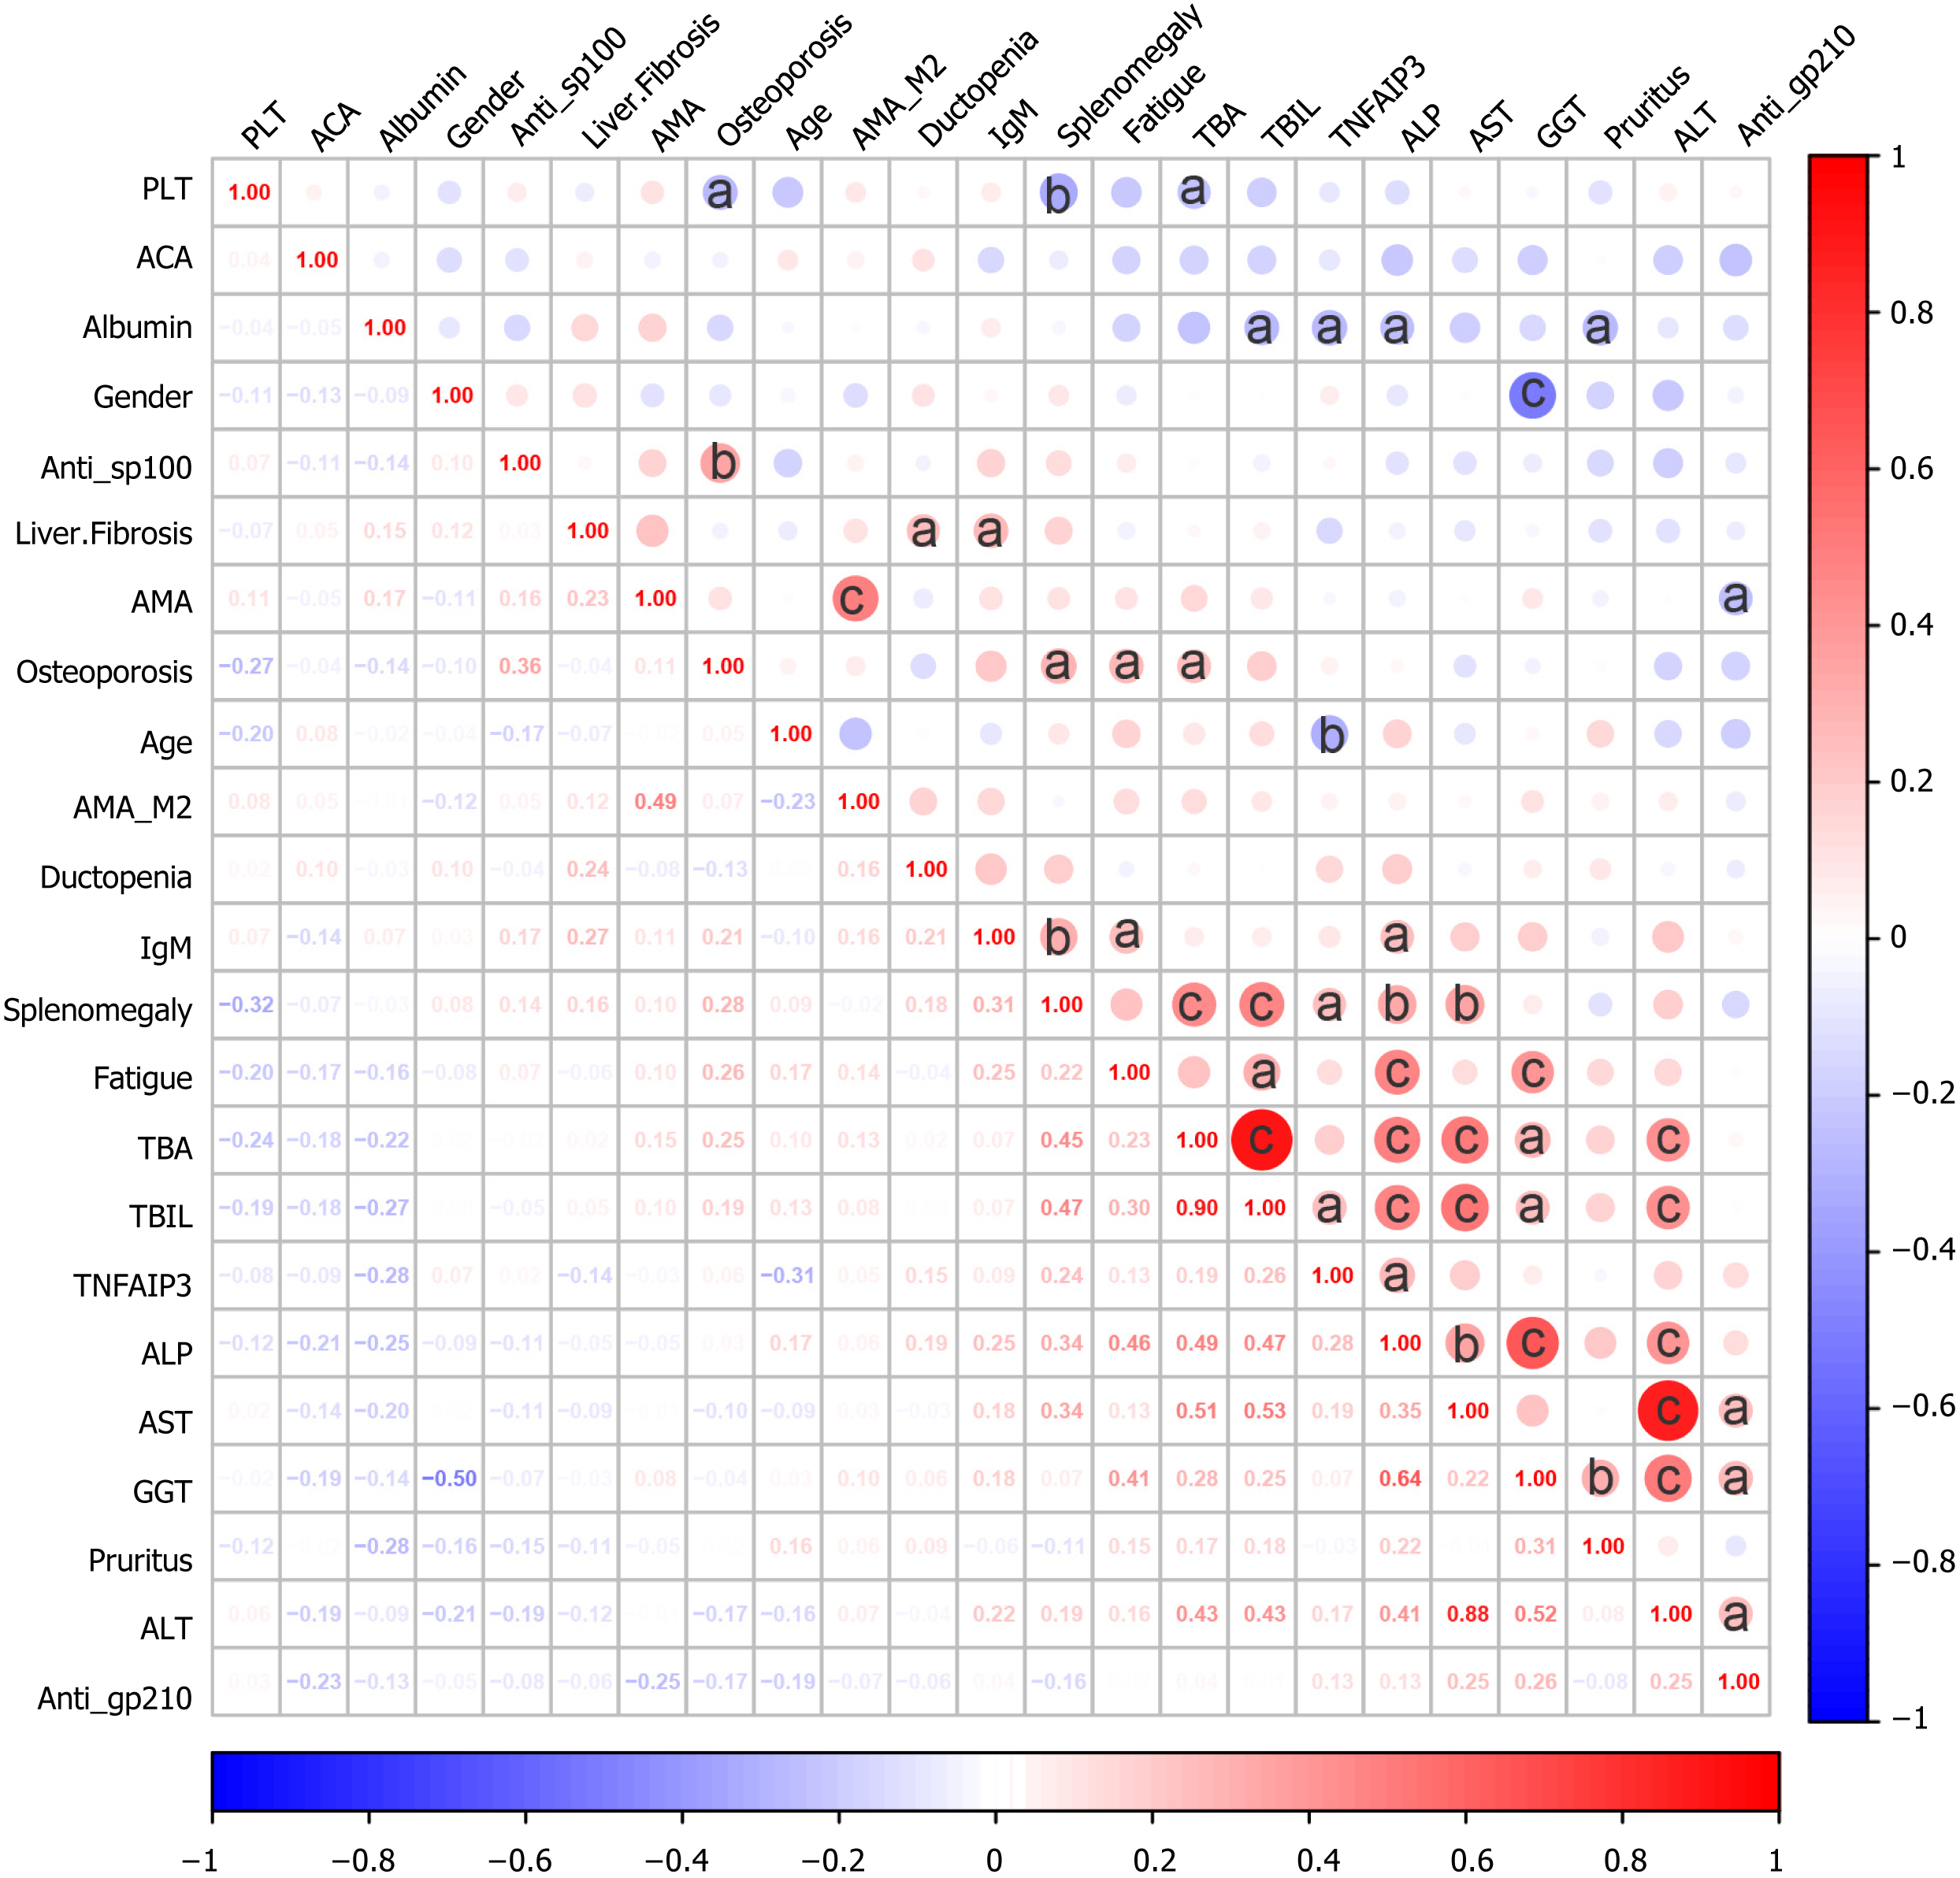
Figure 5 Correlation heatmap.
The heatmap illustrated the correlations between expression of tumor necrosis factor alpha-induced protein 3 and various clinical parameters in primary biliary cholangitis patients. The color of the circles indicates the status of the correlation, with red representing positive correlations and blue representing negative correlations. The size and color depth of the circles represent the strength of the correlation, with larger and darker circles indicating stronger correlations. Asterisks denote statistically significant correlations (aP < 0.05, bP < 0.01, cP < 0.001). TNFAIP3: Tumor necrosis factor alpha-induced protein 3; PLT: Platelets; ACA: Anti-centromere antibodies; AMA: Anti-mitochondrial antibodies; IgM: Immunoglobulin M; TBA: Total bile acid; TBIL: Total bilirubin; ALP: Alkaline phosphatase; AST: Aspartate aminotransferase; GGT: Gamma-glutamyl transpeptidase; ALT: Alanine aminotransferase.
- Citation: Zang B, Li JX, Liu QX, Yao Y, Li H, Wang Y, Wang JG, Yang YF, Liang RW, Xin XR, Liu B. Tumor necrosis factor alpha-induced protein 3: A key biomarker for response to ursodeoxycholic acid in primary biliary cholangitis. World J Hepatol 2025; 17(7): 107666
- URL: https://www.wjgnet.com/1948-5182/full/v17/i7/107666.htm
- DOI: https://dx.doi.org/10.4254/wjh.v17.i7.107666


