Copyright
©The Author(s) 2025.
World J Hepatol. Jul 27, 2025; 17(7): 107666
Published online Jul 27, 2025. doi: 10.4254/wjh.v17.i7.107666
Published online Jul 27, 2025. doi: 10.4254/wjh.v17.i7.107666
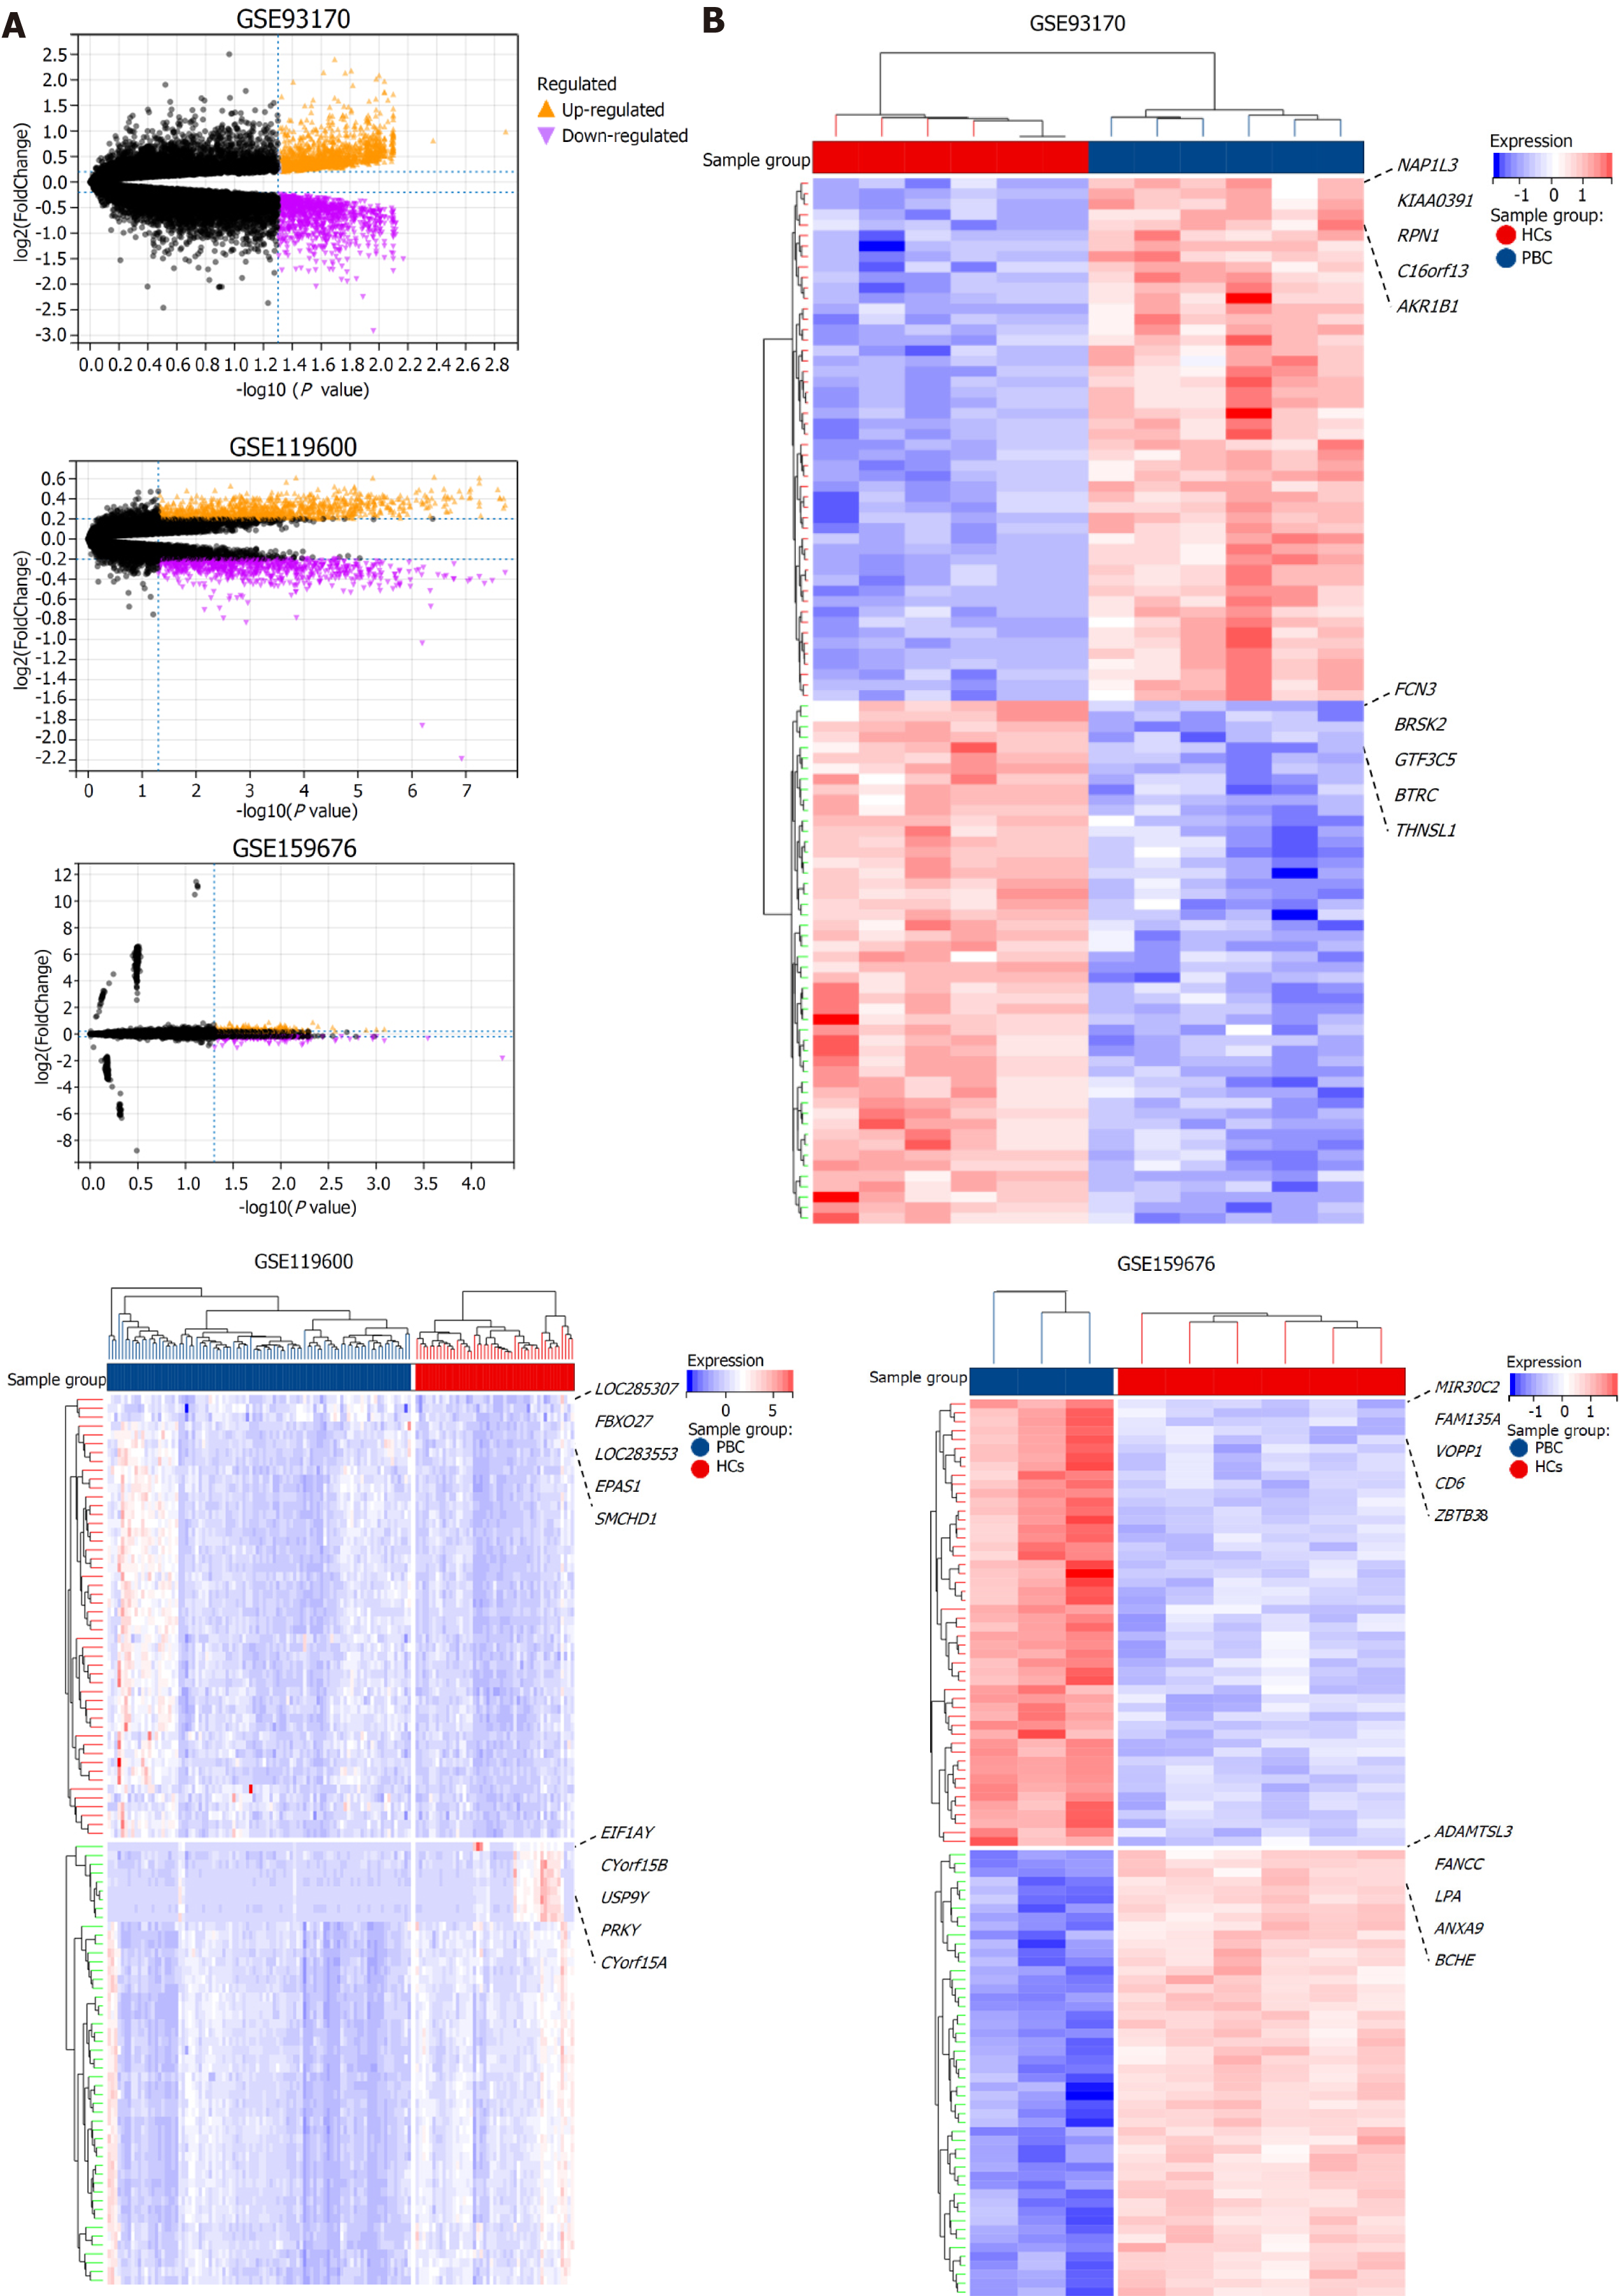
Figure 2 Volcano plots and heatmaps of differentially expressed genes in primary biliary cholangitis datasets.
A: Volcano plots of differentially expressed genes (DEGs) identified in GSE93170, GSE119600, and GSE159676 datasets. A total of 1335 upregulated and 1012 downregulated genes were identified in GSE93170, 1108 upregulated and 844 downregulated genes in GSE119600, and 375 upregulated and 247 downregulated genes in GSE159676 (adjusted P < 0.05; |log2 fold change| ≥ 0.2). Orange and purple points represent upregulated and downregulated genes, respectively; B: Heatmaps of the top 100 DEGs from each dataset, clustered by expression levels. Red and blue colors indicate higher and lower expression levels, respectively. PBC: Primary biliary cholangitis; HCs: Healthy controls.
- Citation: Zang B, Li JX, Liu QX, Yao Y, Li H, Wang Y, Wang JG, Yang YF, Liang RW, Xin XR, Liu B. Tumor necrosis factor alpha-induced protein 3: A key biomarker for response to ursodeoxycholic acid in primary biliary cholangitis. World J Hepatol 2025; 17(7): 107666
- URL: https://www.wjgnet.com/1948-5182/full/v17/i7/107666.htm
- DOI: https://dx.doi.org/10.4254/wjh.v17.i7.107666


