Copyright
©The Author(s) 2025.
World J Hepatol. Jul 27, 2025; 17(7): 106151
Published online Jul 27, 2025. doi: 10.4254/wjh.v17.i7.106151
Published online Jul 27, 2025. doi: 10.4254/wjh.v17.i7.106151
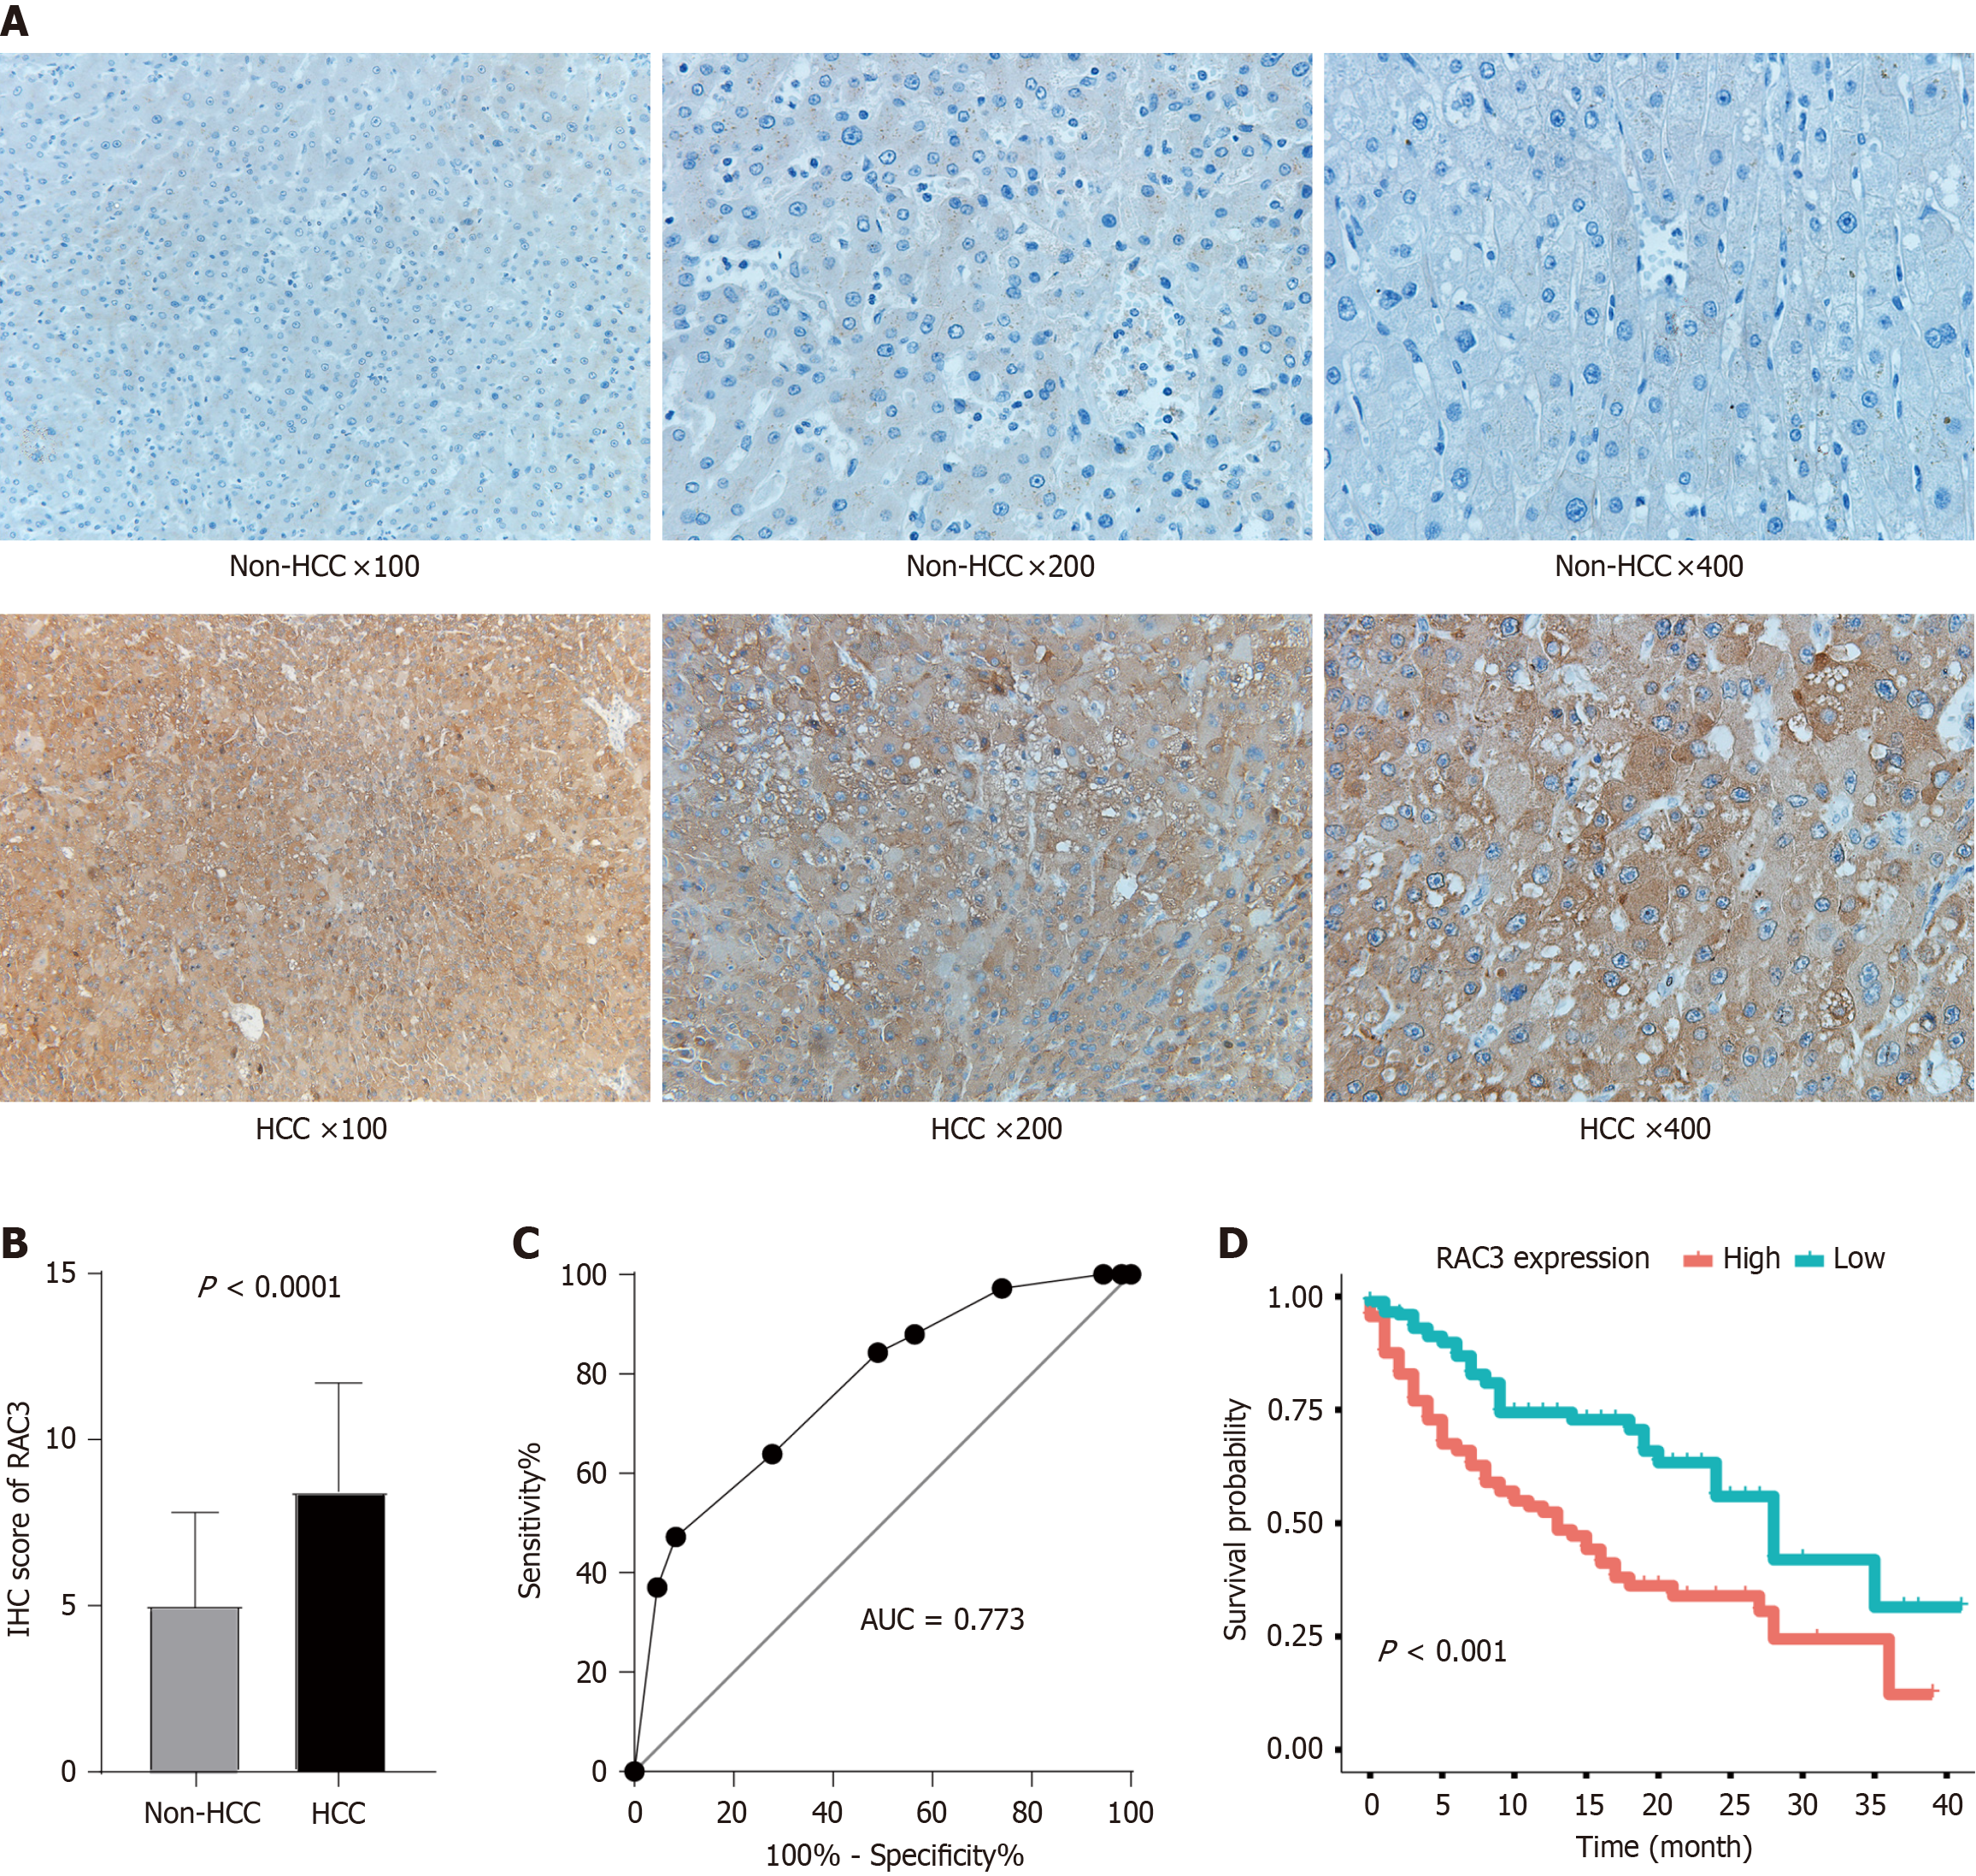
Figure 3 Clinical relevance of Rac family small GTPase 3 dysregulation in hepatocellular carcinoma.
A: Representative immunohistochemical (IHC) staining demonstrating differential Rac family small GTPase 3 (RAC3) expression between hepatocellular carcinoma and adjacent non-tumorous liver tissues; B: Quantitative comparison of IHC H-scores in matched tumor-normal pairs (P < 0.001, paired t-test); C: Diagnostic performance evaluation using receiver operating characteristic curve analysis (area under curve = 0.82, 95%CI: 0.76–0.89); D: Kaplan–Meier survival curves stratified by RAC3 expression levels with clinicopathological correlations. AUC: Area under curve; HCC: Hepatocellular carcinoma; RAC3: Rac family small GTPase 3.
- Citation: Liu R, Li JC, Li SD, Li JD, He RQ, Chen G, Feng ZB, Wei JL. Deciphering the oncogenic role of Rac family small GTPase 3 in hepatocellular carcinoma through multiomics integration. World J Hepatol 2025; 17(7): 106151
- URL: https://www.wjgnet.com/1948-5182/full/v17/i7/106151.htm
- DOI: https://dx.doi.org/10.4254/wjh.v17.i7.106151


