Copyright
©The Author(s) 2025.
World J Hepatol. May 27, 2025; 17(5): 106124
Published online May 27, 2025. doi: 10.4254/wjh.v17.i5.106124
Published online May 27, 2025. doi: 10.4254/wjh.v17.i5.106124
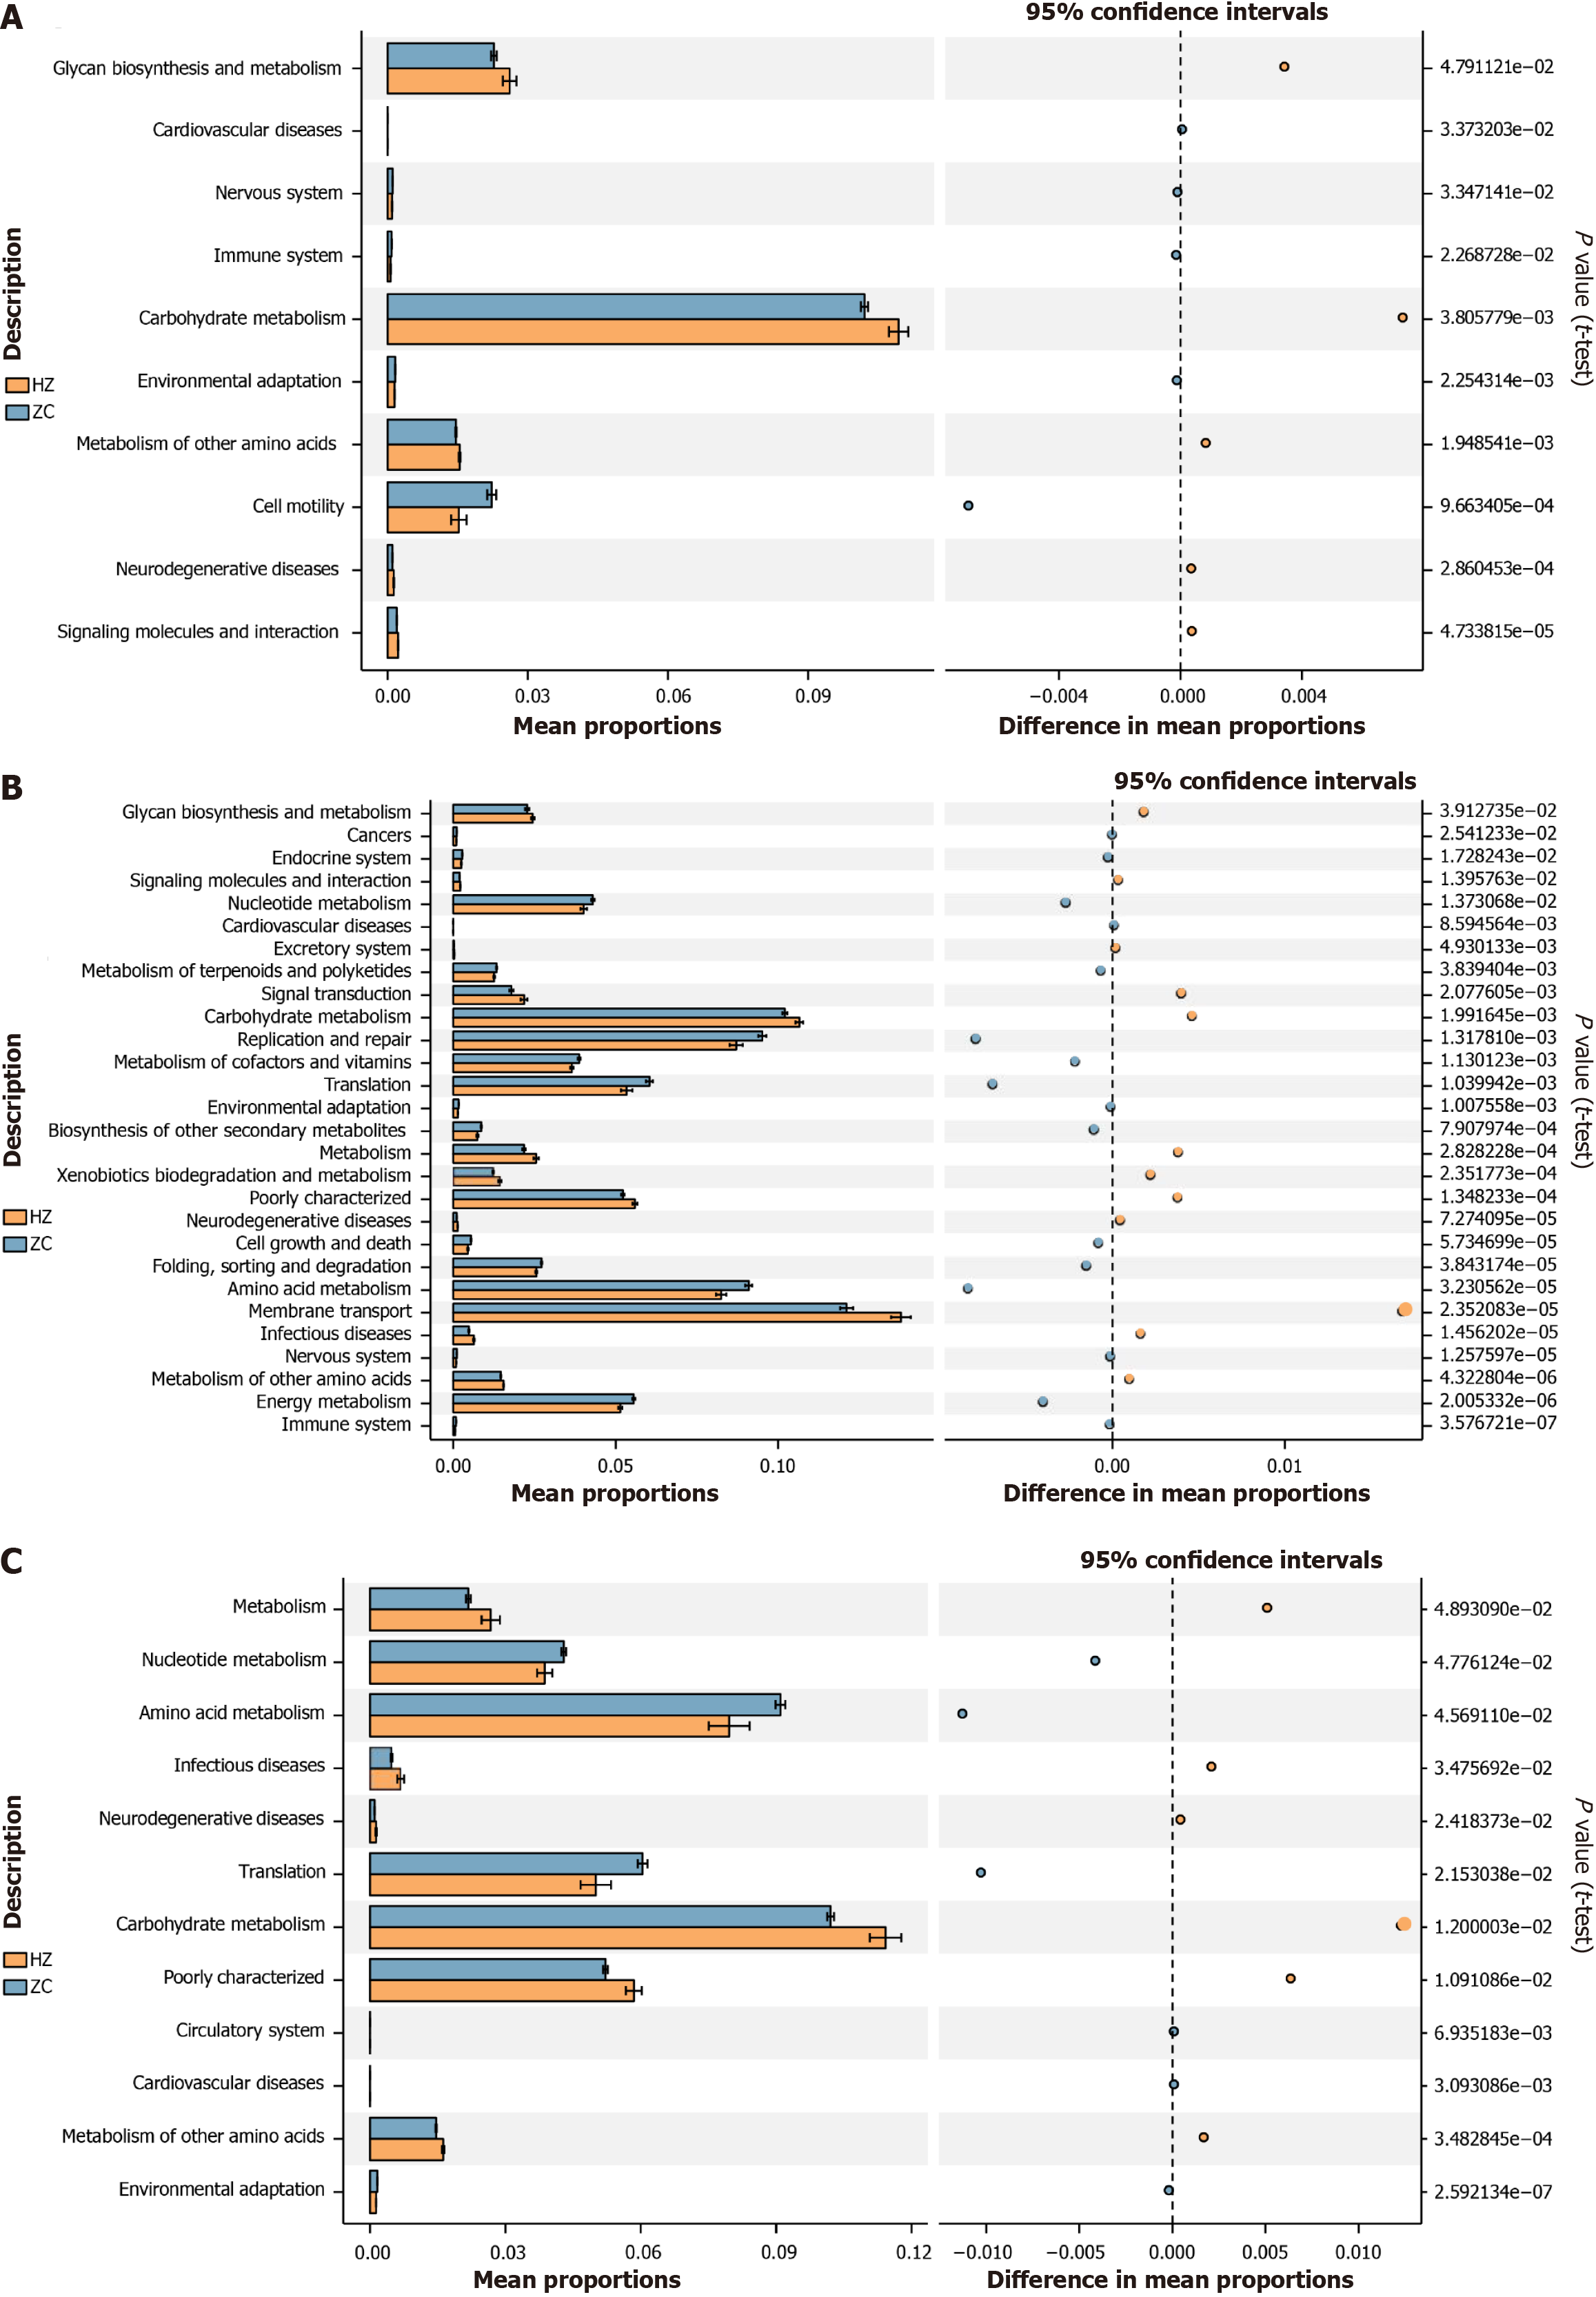
Figure 8 The gut microbiota function prediction: contrasting the healthy control with chronic hepatitis B, cirrhosis, and hepatocellular carcinoma group.
A: Prediction of gut microbiota function between the chronic hepatitis B group and the healthy control group. Utilizing PICRUSt software and Kyoto Encyclopedia of Genes and Genomes enrichment analysis, this study functionally annotated the 16S rDNA gene sequencing data with the Kyoto Encyclopedia of Genes and Genomes Orthology database to further analyze the metabolic functions at level 2 of the GM. Functional differences were presented, with P values < 0.05 from pairwise t-test comparisons; B: Prediction of GM function between the cirrhosis group and the healthy control group; C: Prediction of GM function between the hepatocellular carcinoma group and the healthy control group. ZC: Healthy control group; HZ: Chronic hepatitis B group; LC: Liver cirrhosis; HCC: Hepatocellular carcinoma.
- Citation: Ma C, Yang J, Fu XN, Luo JY, Liu P, Zeng XL, Li XY, Zhang SL, Zheng S. Microbial characteristics of gut microbiome dysbiosis in patients with chronic liver disease. World J Hepatol 2025; 17(5): 106124
- URL: https://www.wjgnet.com/1948-5182/full/v17/i5/106124.htm
- DOI: https://dx.doi.org/10.4254/wjh.v17.i5.106124


