Copyright
©The Author(s) 2025.
World J Hepatol. Apr 27, 2025; 17(4): 102027
Published online Apr 27, 2025. doi: 10.4254/wjh.v17.i4.102027
Published online Apr 27, 2025. doi: 10.4254/wjh.v17.i4.102027
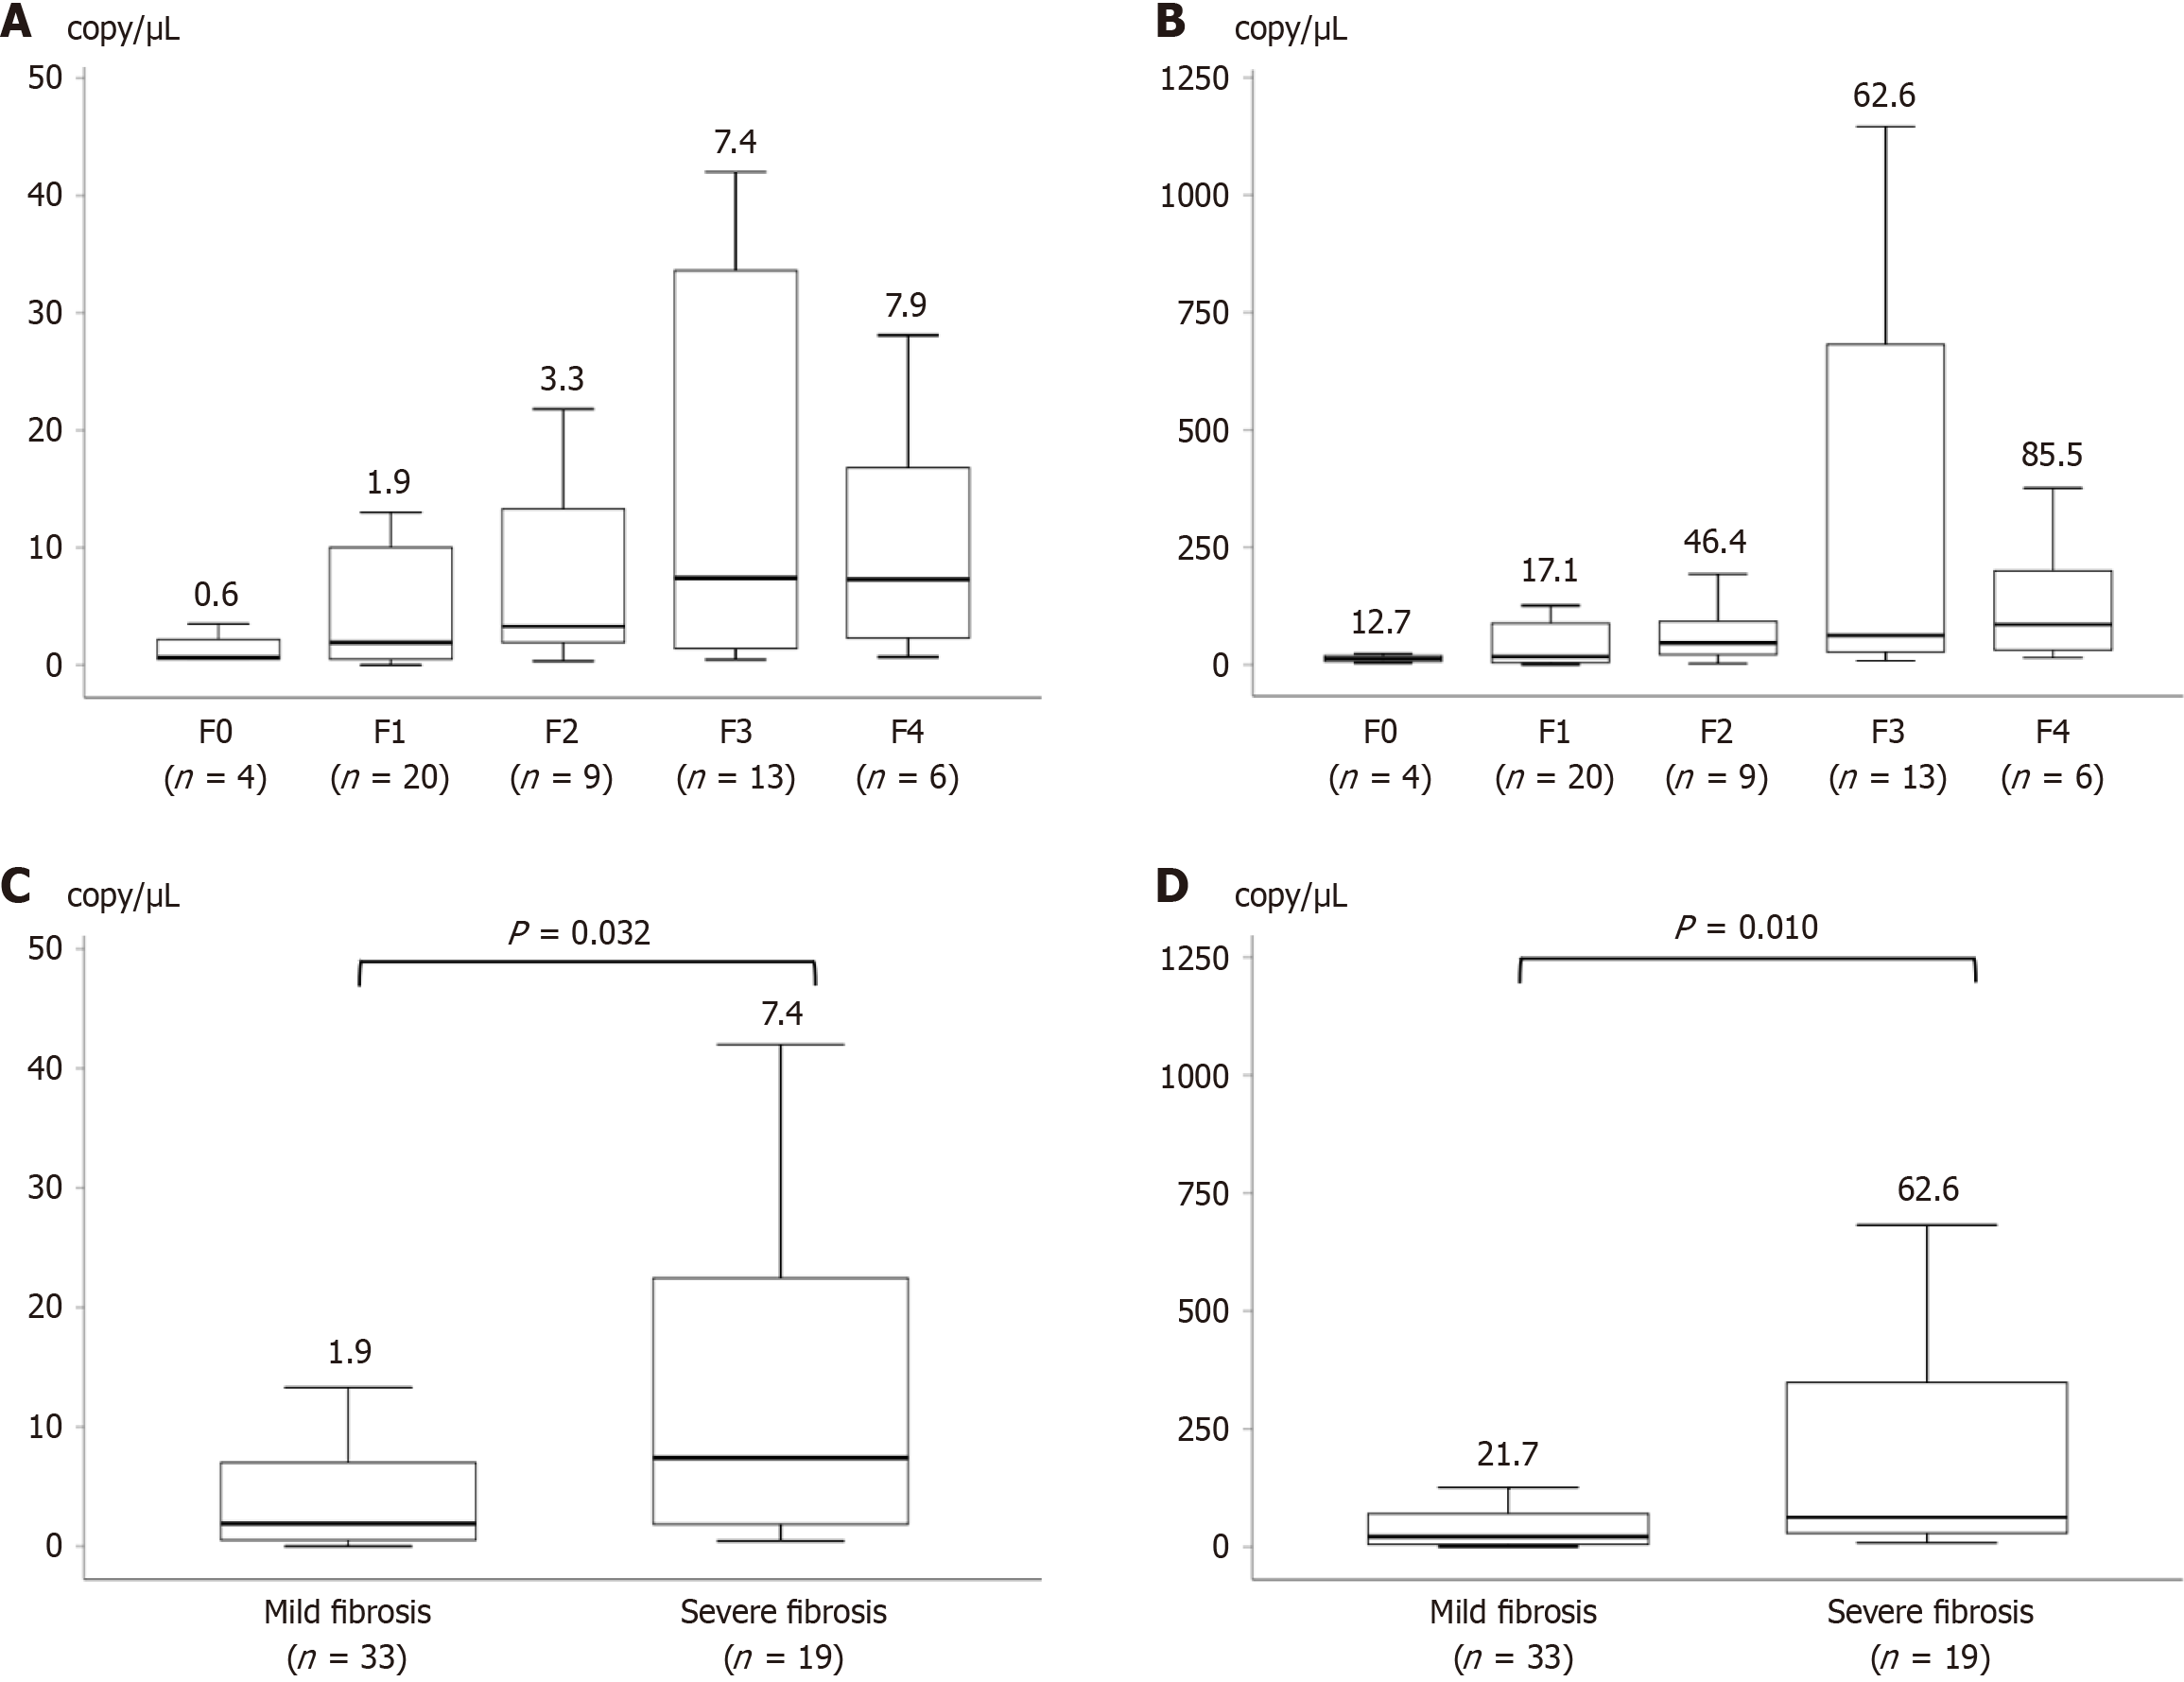
Figure 4 Correlation between the bacterial load.
A: Correlation between fibrosis stage and the bacterial load measured using digital PCR (dPCR) with tnpA; B: Correlation between fibrosis stage and the bacterial load measured using dPCR with 16S rRNA; C: Comparisons between mild and severe fibrosis in the bacterial load measured using dPCR with tnpA; D: Comparisons between mild and severe fibrosis in the bacterial load measured using dPCR with 16S rRNA.
- Citation: Iwasaki S, Také A, Uojima H, Horio K, Sakaguchi Y, Gotoh K, Satoh T, Hidaka H, Tanaka Y, Hayashi S, Kusano C. Quantification of Streptococcus salivarius using the digital polymerase chain reaction as a liver fibrosis marker. World J Hepatol 2025; 17(4): 102027
- URL: https://www.wjgnet.com/1948-5182/full/v17/i4/102027.htm
- DOI: https://dx.doi.org/10.4254/wjh.v17.i4.102027


