Copyright
©The Author(s) 2025.
World J Hepatol. Apr 27, 2025; 17(4): 102027
Published online Apr 27, 2025. doi: 10.4254/wjh.v17.i4.102027
Published online Apr 27, 2025. doi: 10.4254/wjh.v17.i4.102027
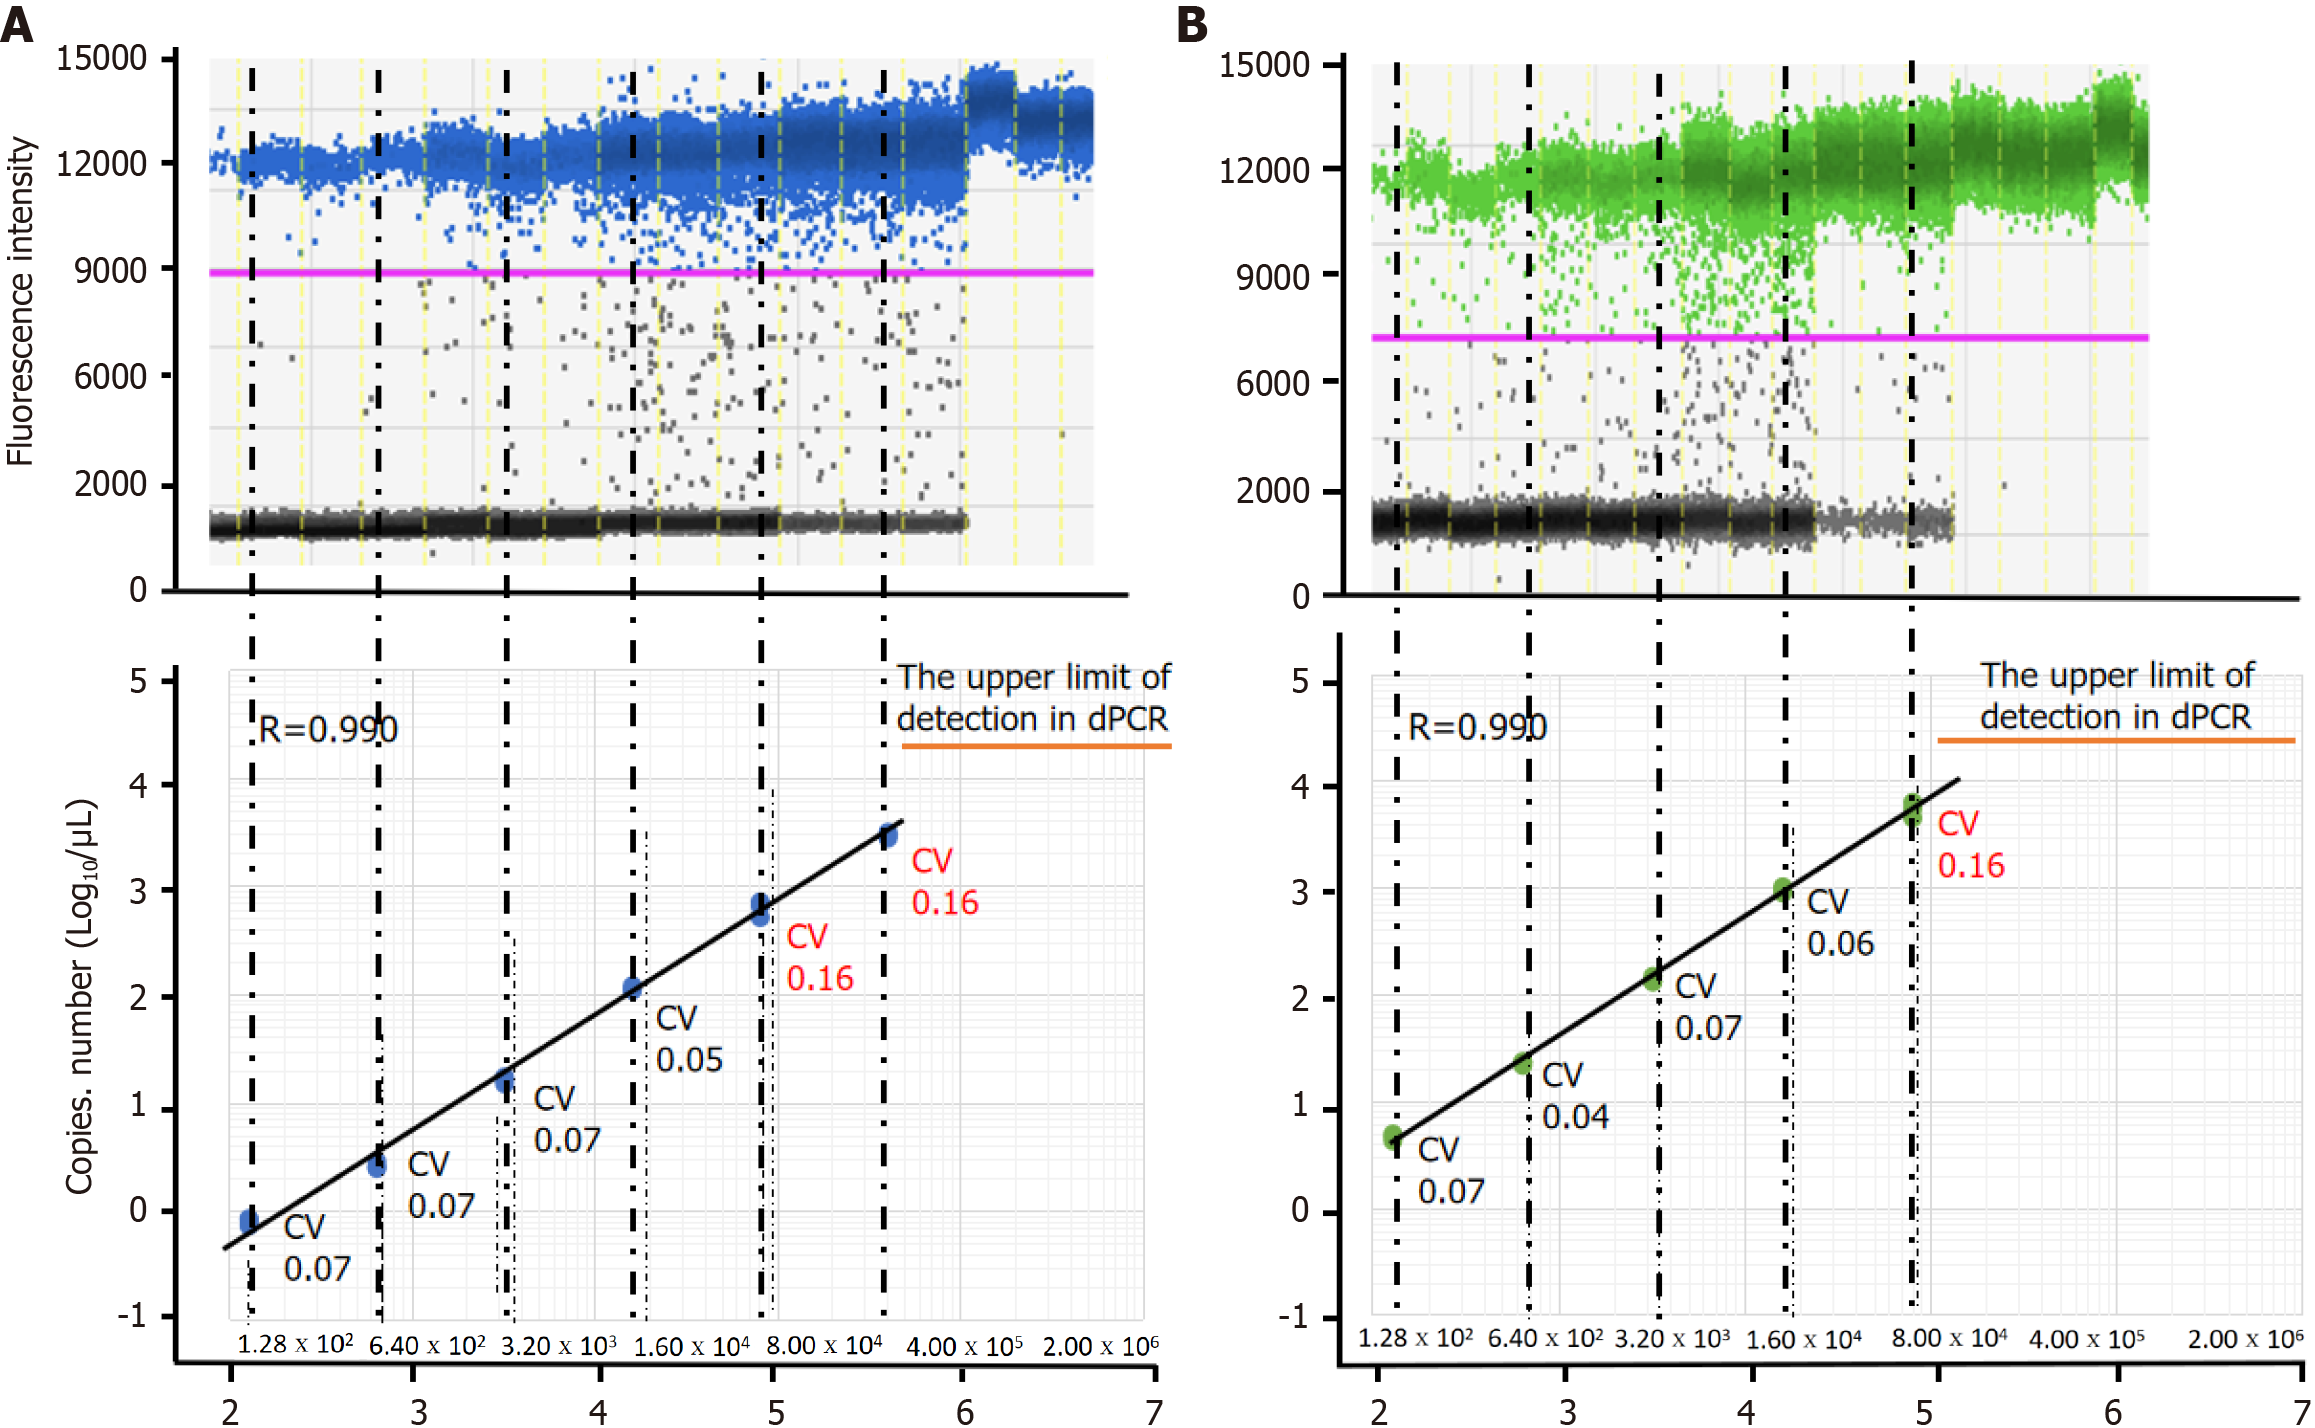
Figure 2 Comparison of bacterial load measured using digital PCR and bacterial titremeasured using plaque assay.
A: Profiles of digital PCR (dPCR) assays targeting the tnpA on bacterial suspensions of Streptococcus salivarius (S. salivarius) strain; B: Profiles of dPCR assays targeting 16S rRNA in S. salivarius bacterial suspensions. Fluorescence amplitude plot of dPCR assays on bacterial suspensions at 5-fold diluted concentrations from 2.00 × 10⁶ to 1.28 × 10² colony forming unit/mL. The blue line represents a threshold to distinguish between positive and negative droplets based on the fluorescence signal. Droplets with a fluorescence signal above this threshold are classified as positive, indicating the presence of amplification. dPCR: Digital PCR; CV: Coefficients of variability; CFU: Colony forming unit.
- Citation: Iwasaki S, Také A, Uojima H, Horio K, Sakaguchi Y, Gotoh K, Satoh T, Hidaka H, Tanaka Y, Hayashi S, Kusano C. Quantification of Streptococcus salivarius using the digital polymerase chain reaction as a liver fibrosis marker. World J Hepatol 2025; 17(4): 102027
- URL: https://www.wjgnet.com/1948-5182/full/v17/i4/102027.htm
- DOI: https://dx.doi.org/10.4254/wjh.v17.i4.102027


