
















©The Author(s) 2025.
World J Hepatol. Dec 27, 2025; 17(12): 113660
Published online Dec 27, 2025. doi: 10.4254/wjh.v17.i12.113660
Published online Dec 27, 2025. doi: 10.4254/wjh.v17.i12.113660
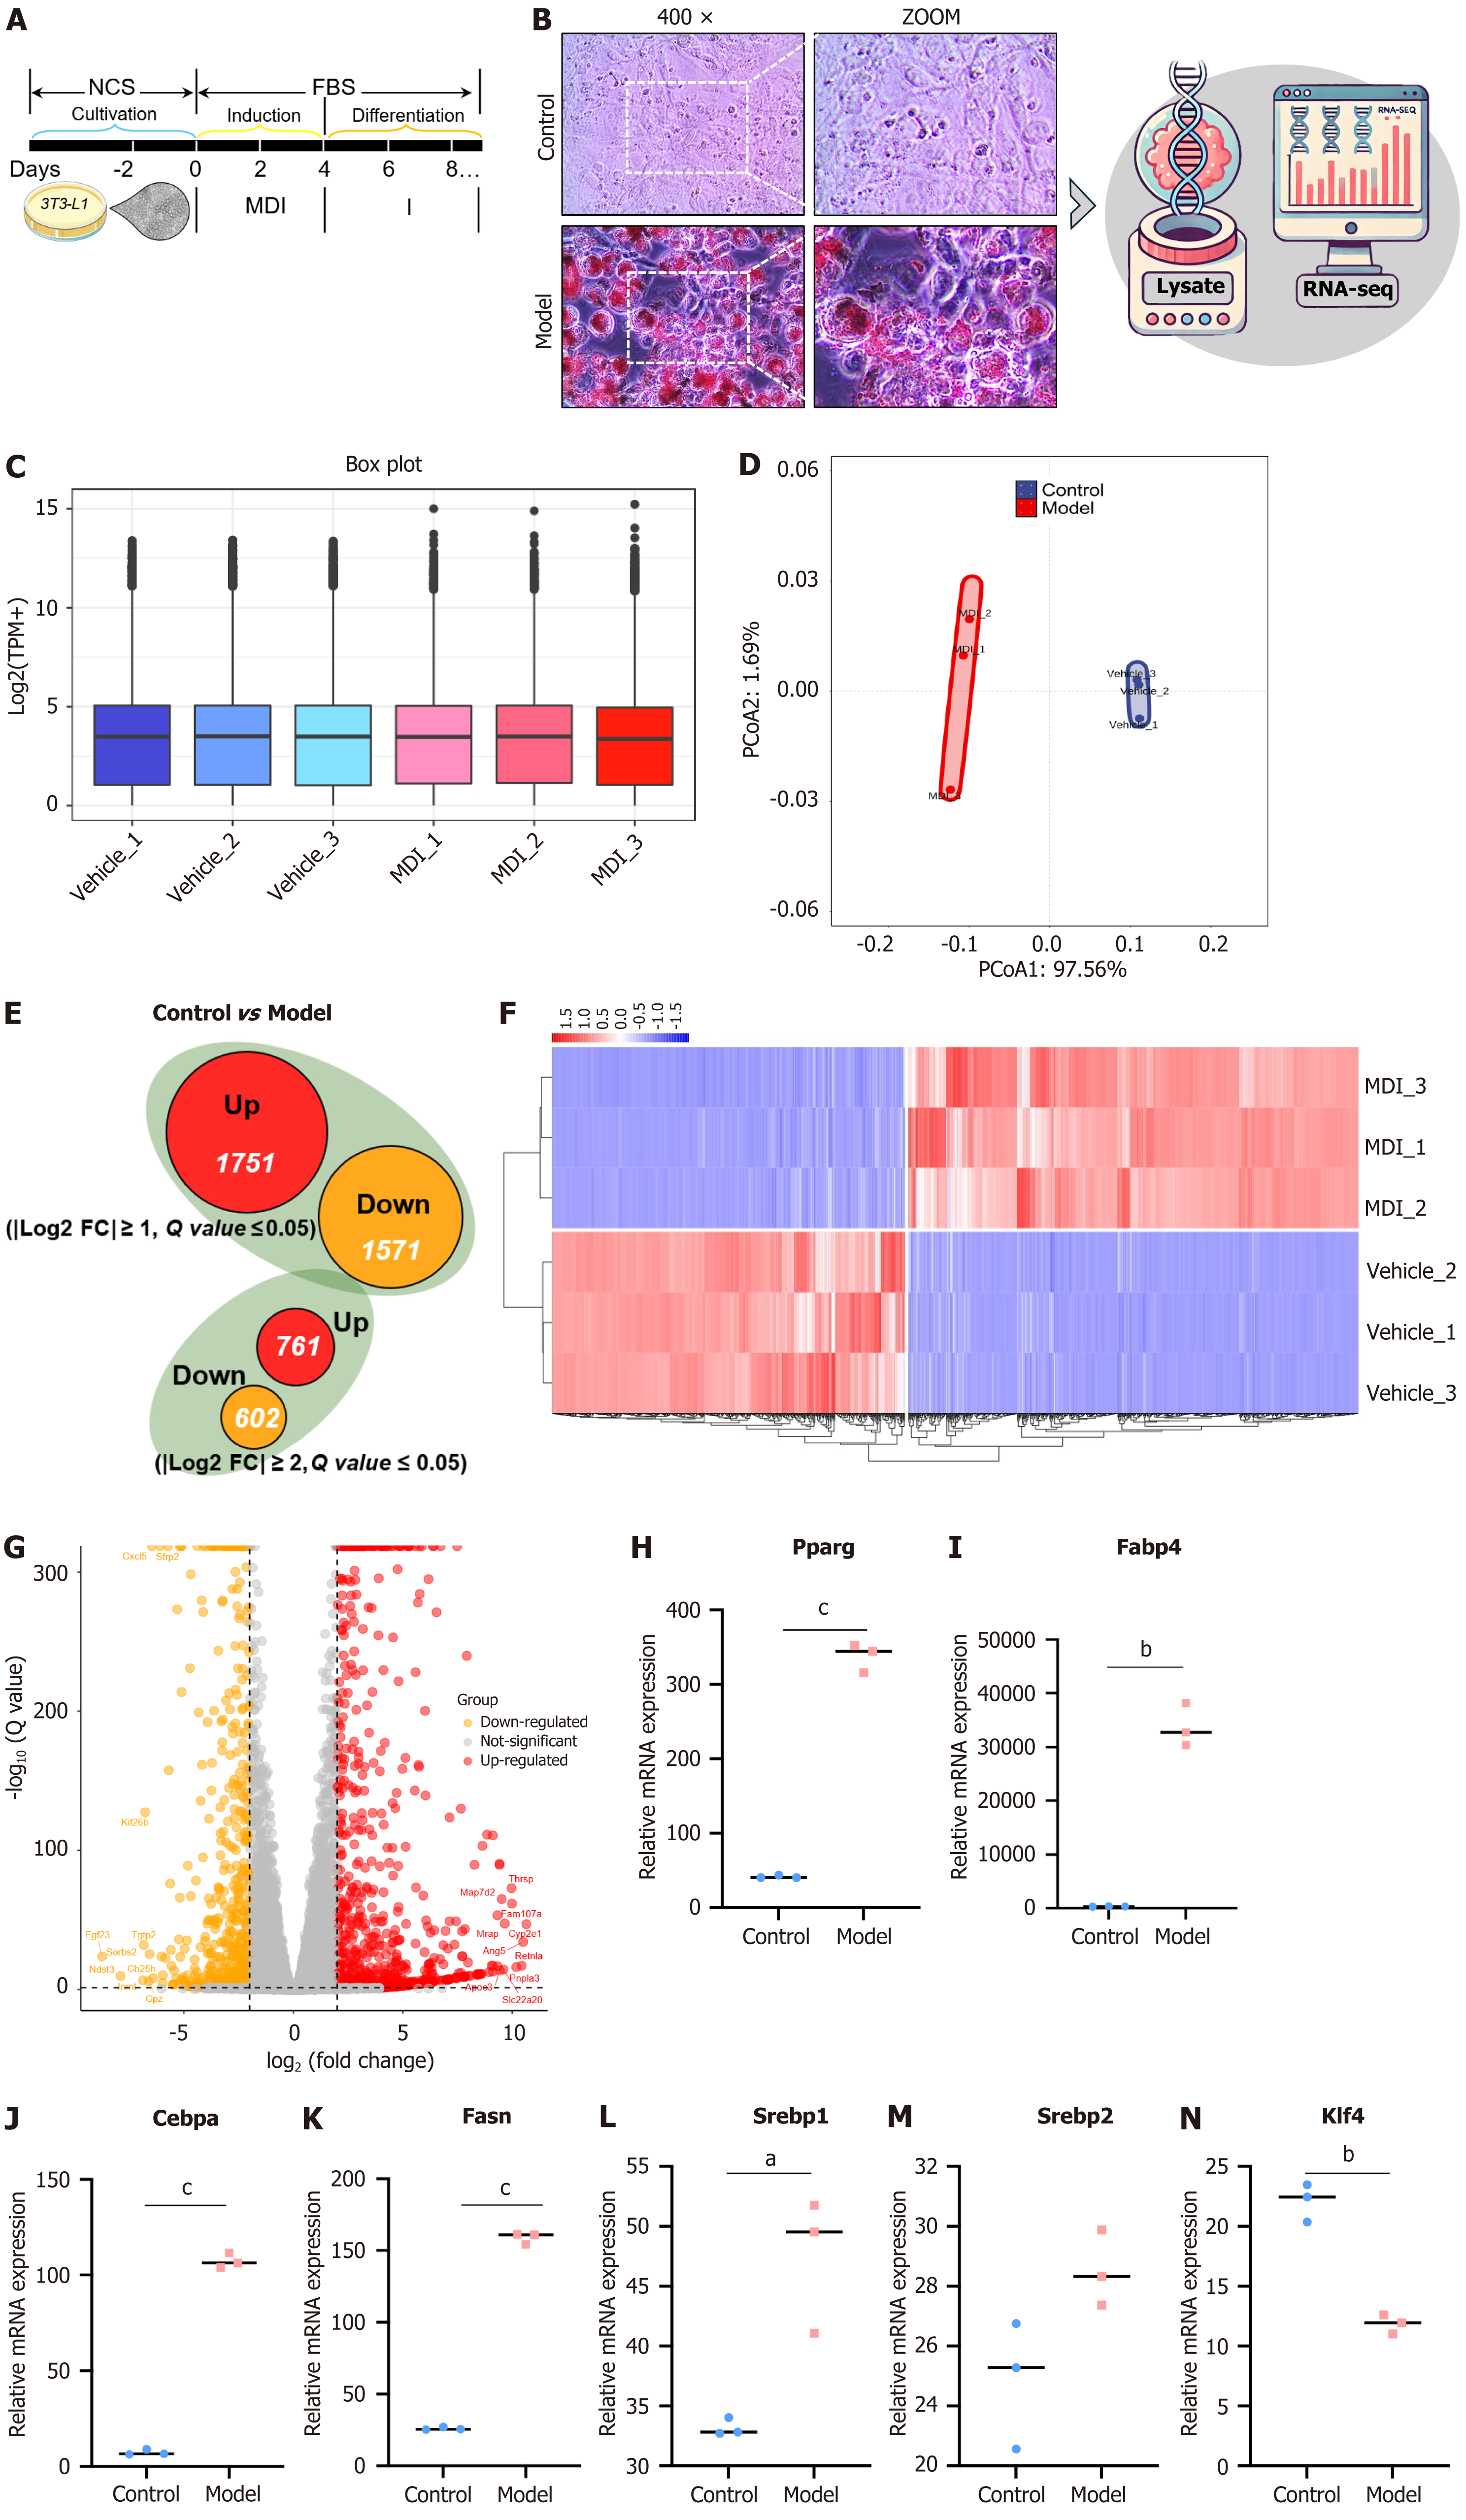
Figure 2 RNA sequencing analysis of the differences in 3T3-L1 cell differentiation.
A: Schematic diagram of 3T3-L1 cell culture and differentiation process; B: Oil red O staining images in the control group vs model group on day 6; C: Box plot of gene expression of samples (n = 3); D: Principal coordinate analysis plot of gene expression of samples (n = 3); E: The number of up-regulated or down-regulated differential genes between control and model groups (n = 3); F and G: Heatmap (F) and volcano plot (G) of differential gene expression for genes demonstrating significant differences based on the screening criteria of |Log2FC| ≥ 2 and q value ≤ 0.05 (n = 3); H-N: Comparison expression of key genes for lipid droplet accumulation and differentiation in control and model groups. Data were expressed as mean ± SEM. 400 ×, 25 μm. aP < 0.05 vs control; bP < 0.005 vs control; cP < 0.001 vs control. PCoA: Principal coordinate analysis; NCS: Newborn calf serum; FBS: Fetal bovine serum; MDI: 3-isobutyl-1-methylxanthine, dexamethasone, and insulin; TPM: Transcripts per million.
- Citation: Cheng Z, Lu YF, He YX, Wei W, Xie YX, Lv TS, Wei Y, Lou Y, Yu JY, Zhou XQ. Integrated serum metabolomics reveal molecular mechanism of Xietu Hemu prescription on metabolic dysfunction-associated steatotic liver disease-related obesity. World J Hepatol 2025; 17(12): 113660
- URL: https://www.wjgnet.com/1948-5182/full/v17/i12/113660.htm
- DOI: https://dx.doi.org/10.4254/wjh.v17.i12.113660