
















©The Author(s) 2025.
World J Hepatol. Dec 27, 2025; 17(12): 113359
Published online Dec 27, 2025. doi: 10.4254/wjh.v17.i12.113359
Published online Dec 27, 2025. doi: 10.4254/wjh.v17.i12.113359
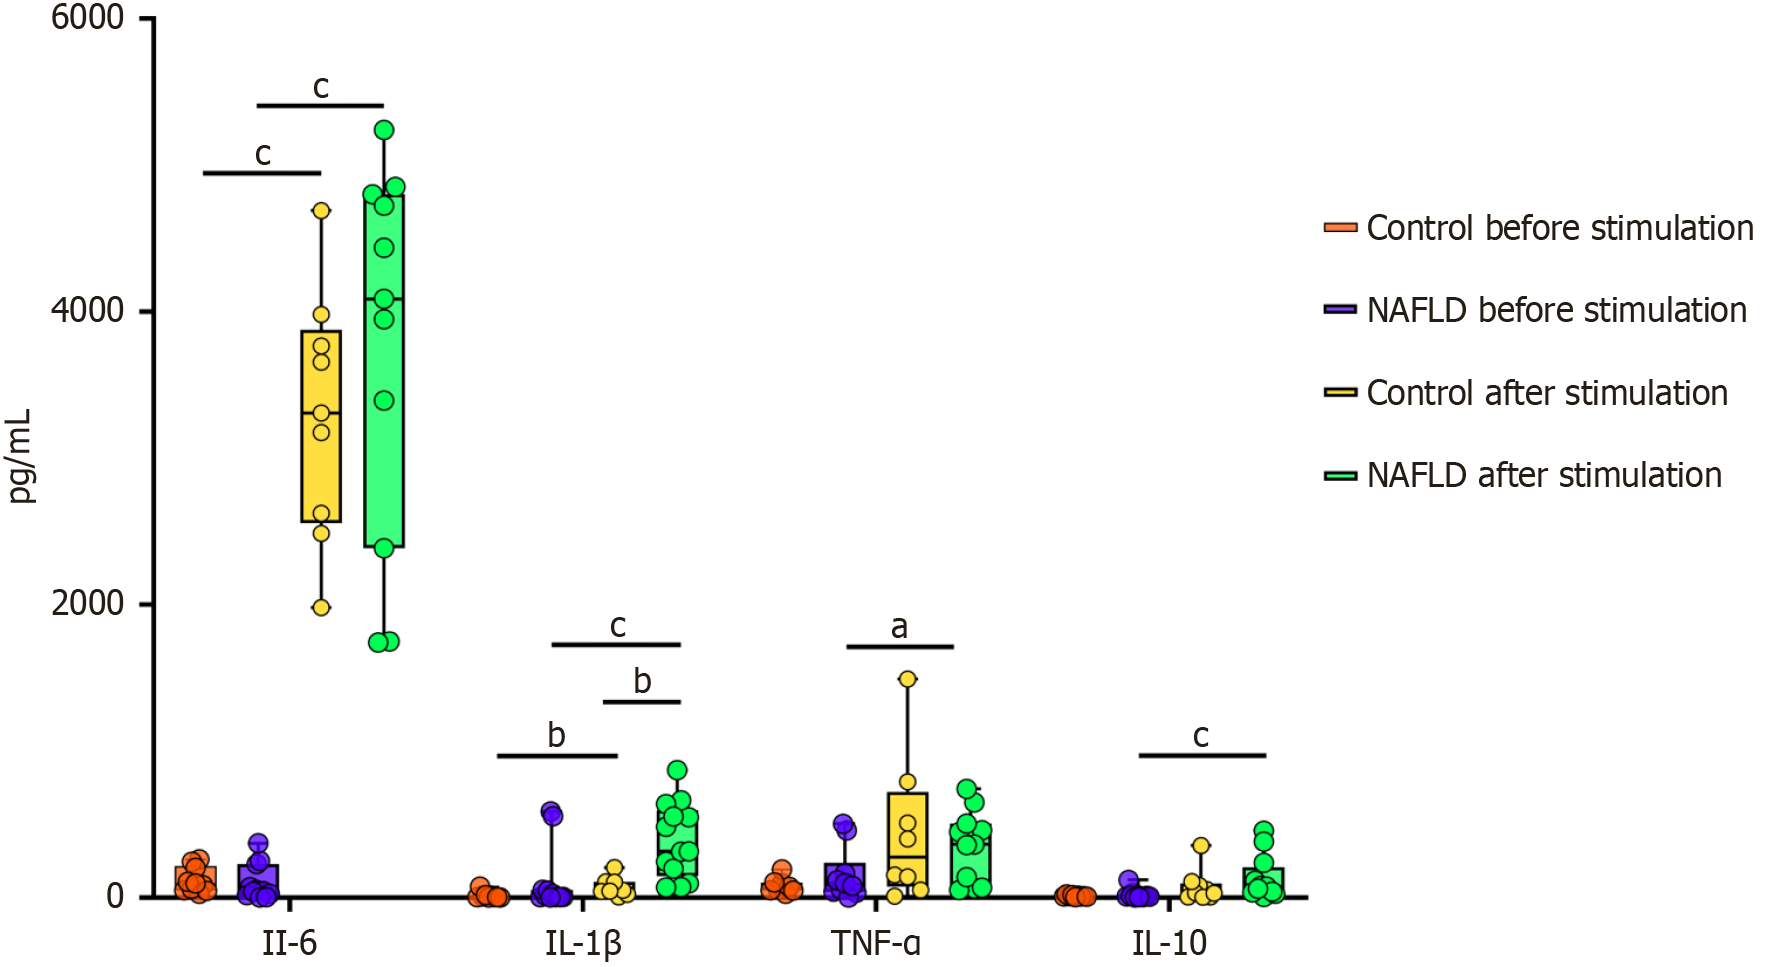
Figure 6 Cytokine production in peripheral blood mononuclear cells isolated from controls and patients with non-alcoholic fatty liver disease patients before and after fecal extract stimulation.
Individual data points are displayed alongside median and interquartile range to visualize the distribution and variability of cytokine production in each group. aP < 0.05; bP < 0.01; cP < 0.001. IL: Interleukin; TNF: Tumor necrosis factor; NAFLD: Non-alcoholic fatty liver disease.
- Citation: Zeber-Lubecka N, Michalkiewicz J, Dabrowska M, Goryca K, Wierzbicka-Rucińska A, Jańczyk W, Jankowska I, Świąder-Leśniak A, Kubiszewska I, Ziemska-Legięcka J, Socha P, Ostrowski J. Transcriptome profiles of peripheral blood mononuclear cells differentiate male adolescents with non-alcoholic fatty liver disease from healthy peers. World J Hepatol 2025; 17(12): 113359
- URL: https://www.wjgnet.com/1948-5182/full/v17/i12/113359.htm
- DOI: https://dx.doi.org/10.4254/wjh.v17.i12.113359