
















©The Author(s) 2025.
World J Hepatol. Dec 27, 2025; 17(12): 113359
Published online Dec 27, 2025. doi: 10.4254/wjh.v17.i12.113359
Published online Dec 27, 2025. doi: 10.4254/wjh.v17.i12.113359
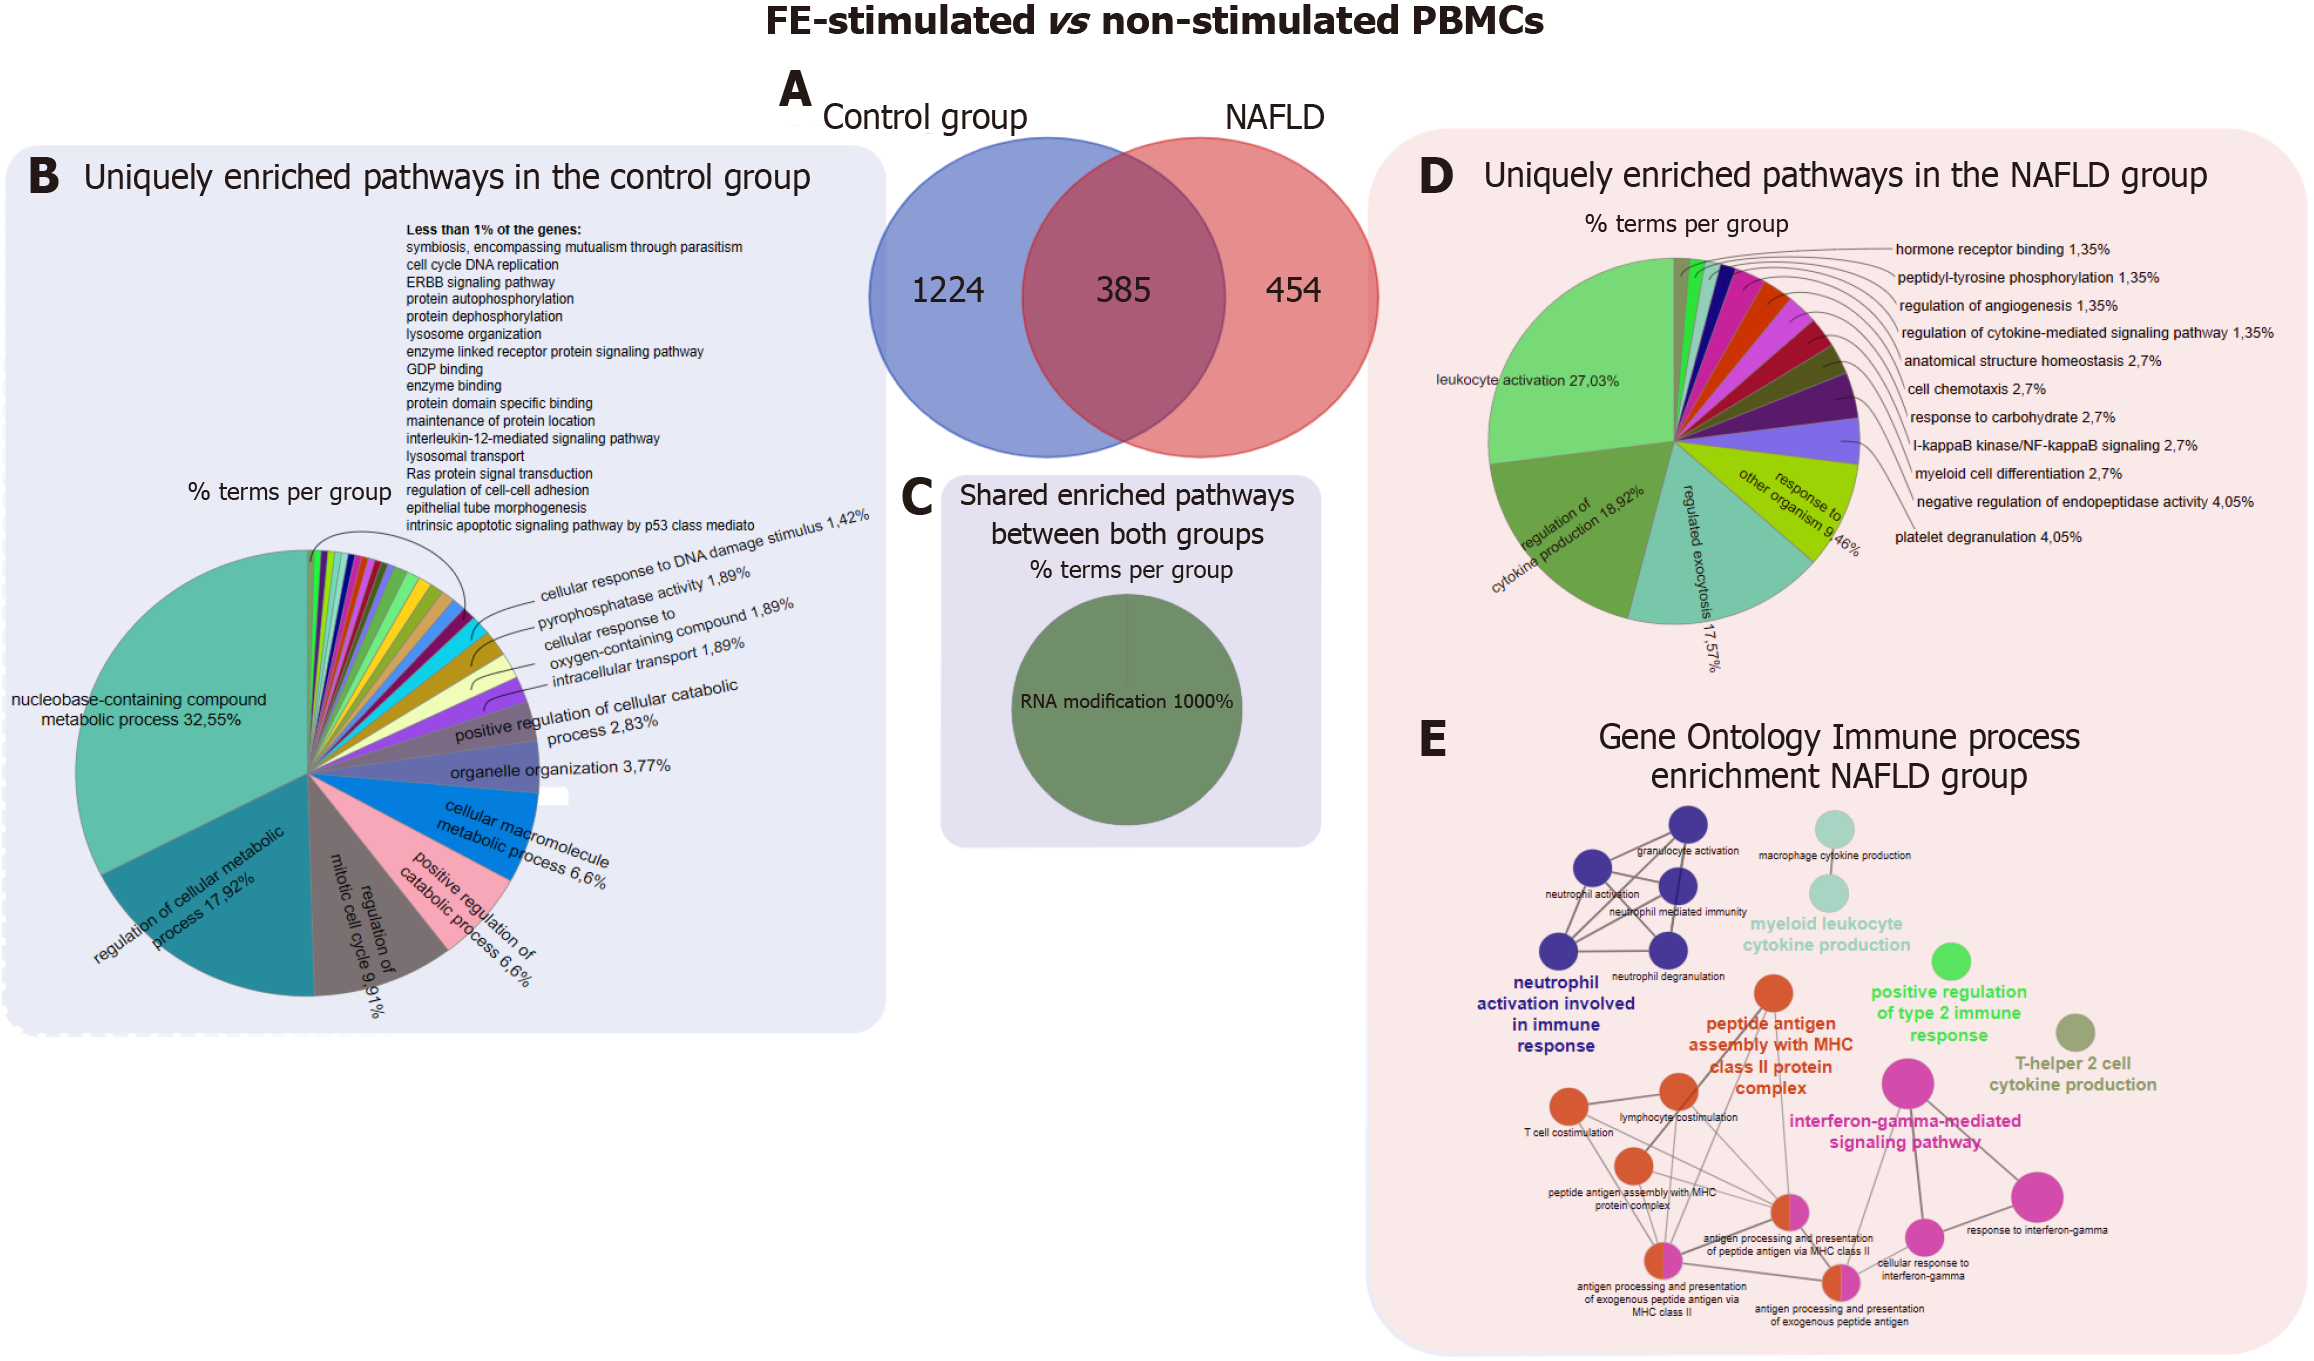
Figure 5 Differential expression genes and functional enrichment analysis of peripheral blood mononuclear cells from patients with non-alcoholic fatty liver disease and controls under fecal extract-stimulated/non-stimulated conditions.
A: Venn diagram of the unique and shared differentially expressed genes in the comparison of fecal extract-stimulated and non-stimulated peripheral blood mononuclear cells isolated from patients with non-alcoholic fatty liver disease patients and controls; B-D: The top overrepresented pathways identified through ClueGO functional enrichment analysis (Gene Ontology (GO): Biological process GO and molecular function) of unique (B and C) and common (D) differentially expressed genes; E: The top overrepresented pathways identified through GO - immune system process functional enrichment analysis of unique genes in the comparison of fecal extract-stimulated and non-stimulated peripheral blood mononuclear cells isolated from patients with non-alcoholic fatty liver disease patients. The percentage values shown in the pie chart represent the relative contribution of each process to the total set of enriched pathways, based on the distribution of differentially expressed genes. FE: Fecal extracts; PBMCs: Peripheral blood mononuclear cells; NAFLD: Non-alcoholic fatty liver disease; ERBB: Family of proteins contains four receptor tyrosine kinases, structurally related to the epidermal growth factor receptor; GDP: Guanosine diphosphate.
- Citation: Zeber-Lubecka N, Michalkiewicz J, Dabrowska M, Goryca K, Wierzbicka-Rucińska A, Jańczyk W, Jankowska I, Świąder-Leśniak A, Kubiszewska I, Ziemska-Legięcka J, Socha P, Ostrowski J. Transcriptome profiles of peripheral blood mononuclear cells differentiate male adolescents with non-alcoholic fatty liver disease from healthy peers. World J Hepatol 2025; 17(12): 113359
- URL: https://www.wjgnet.com/1948-5182/full/v17/i12/113359.htm
- DOI: https://dx.doi.org/10.4254/wjh.v17.i12.113359