
















©The Author(s) 2025.
World J Hepatol. Dec 27, 2025; 17(12): 113359
Published online Dec 27, 2025. doi: 10.4254/wjh.v17.i12.113359
Published online Dec 27, 2025. doi: 10.4254/wjh.v17.i12.113359
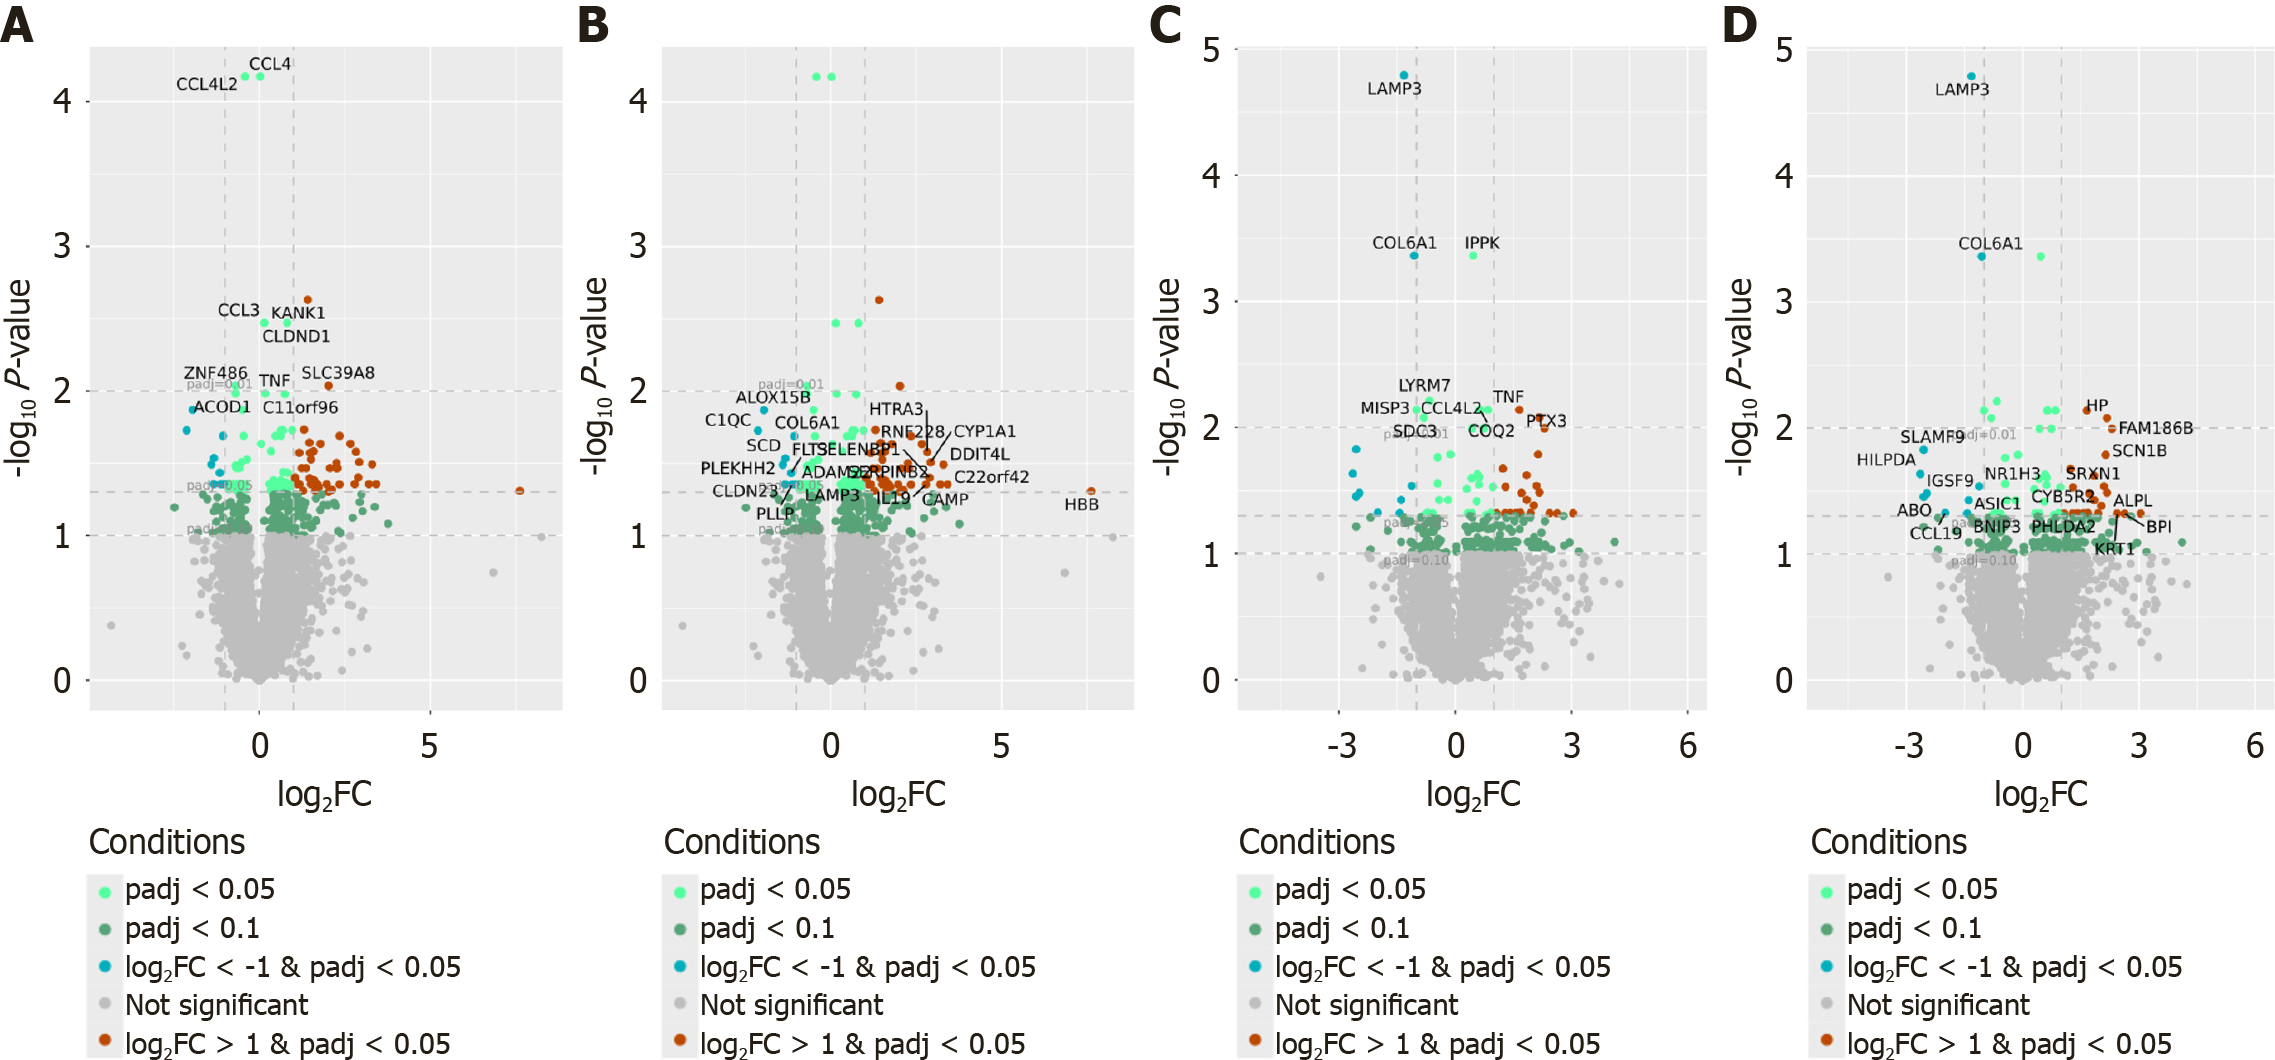
Figure 2 Volcano plots showing differentially expressed genes in peripheral blood mononuclear cells from patients with non-alcoholic fatty liver disease patients compared to healthy controls.
A and B: Non-stimulated peripheral blood mononuclear cells (PBMCs). Genes highlighted based on statistical significance (lowest adjusted P-values) (A), genes highlighted based on fold change (top upregulated and downregulated genes) (B); C and D: Fecal extract-stimulated PBMCs. Genes highlighted based on statistical significance (lowest adjusted P-values) (C), genes highlighted based on fold change (top upregulated and downregulated genes) (D).
- Citation: Zeber-Lubecka N, Michalkiewicz J, Dabrowska M, Goryca K, Wierzbicka-Rucińska A, Jańczyk W, Jankowska I, Świąder-Leśniak A, Kubiszewska I, Ziemska-Legięcka J, Socha P, Ostrowski J. Transcriptome profiles of peripheral blood mononuclear cells differentiate male adolescents with non-alcoholic fatty liver disease from healthy peers. World J Hepatol 2025; 17(12): 113359
- URL: https://www.wjgnet.com/1948-5182/full/v17/i12/113359.htm
- DOI: https://dx.doi.org/10.4254/wjh.v17.i12.113359