
















©The Author(s) 2025.
World J Hepatol. Dec 27, 2025; 17(12): 111418
Published online Dec 27, 2025. doi: 10.4254/wjh.v17.i12.111418
Published online Dec 27, 2025. doi: 10.4254/wjh.v17.i12.111418
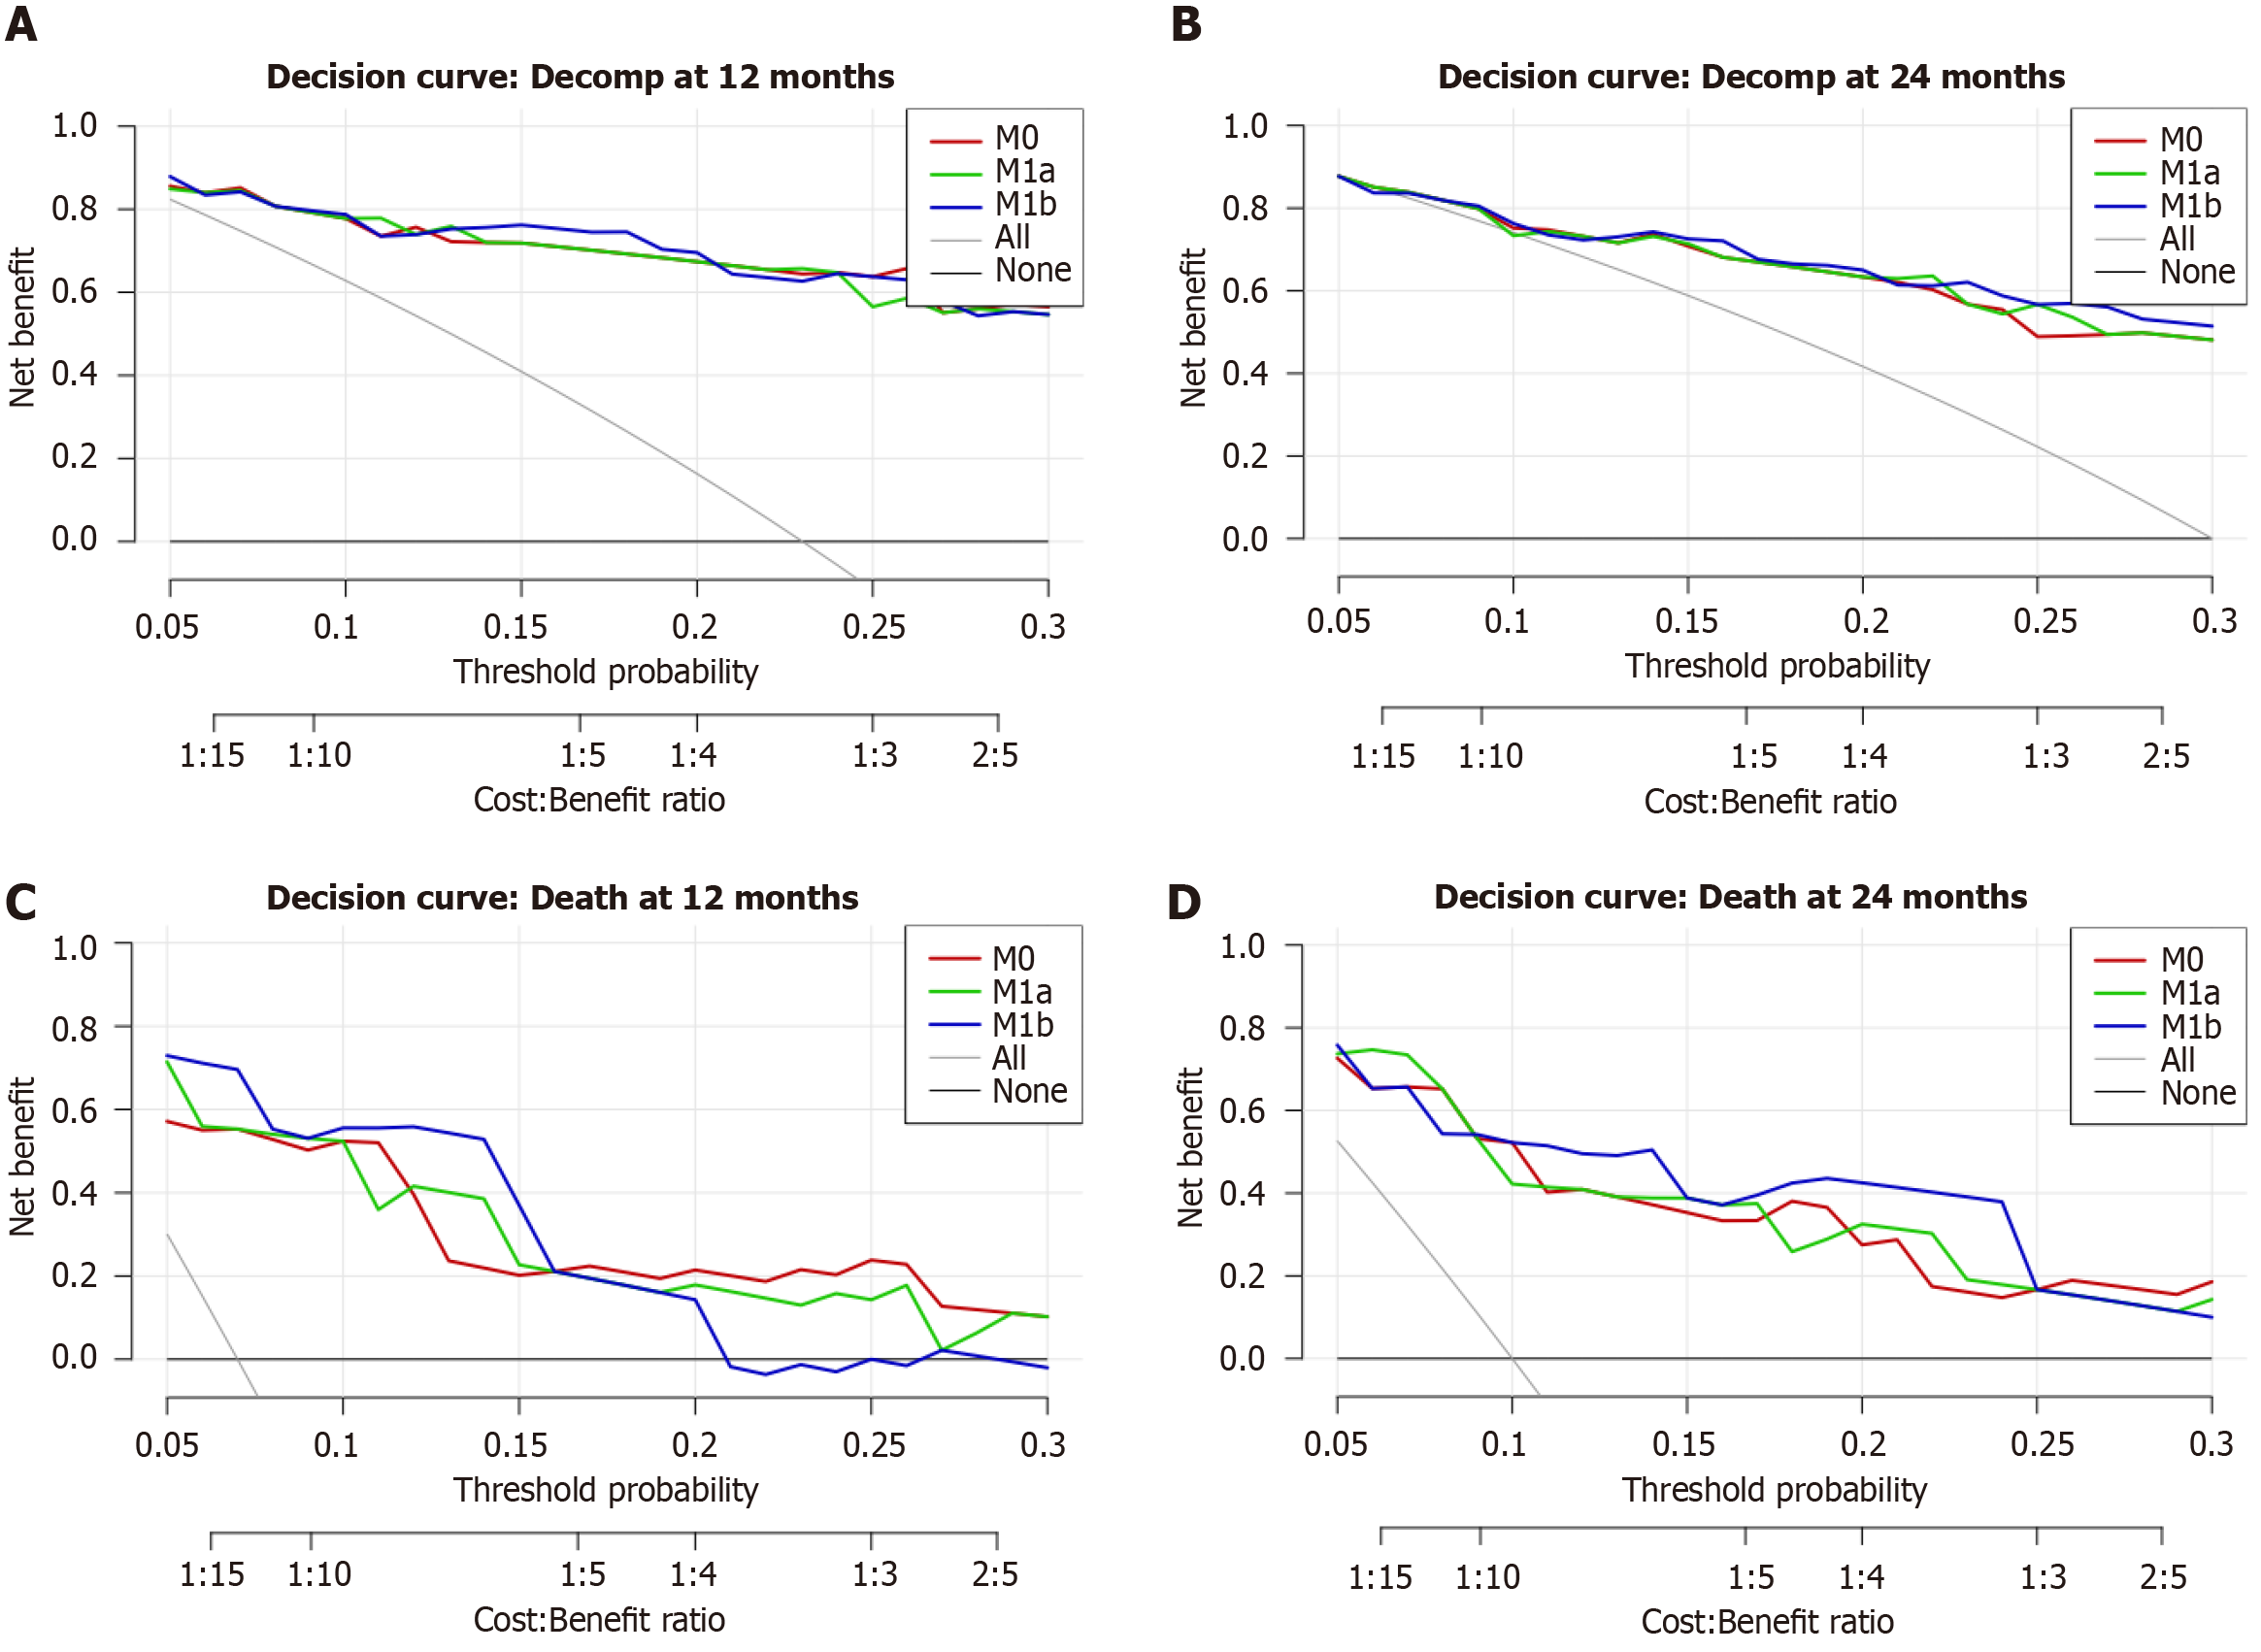
Figure 7 Decision-curve analysis.
A and B: Decision-curve analysis at 12 and 24-month decompensation. A: Decision-curve analysis for 12-month decompensation. Curves largely overlap across 5%-30% thresholds; no material net-benefit differences are apparent; B: Decision-curve analysis for 24-month decompensation. A minor advantage for hepatic enhancement (HE)-global is visible around 18%-24%; otherwise, the curves overlap; C and D: Decision-curve analysis at 12 and 24-month mortality; C: Decision-curve analysis for 12-month mortality. Net benefit is plotted against threshold probability. The global HE extension (M1b) modestly exceeds the reference model by 7%-16%; the HE-segment-VI extension (M1a) is comparable to M0, with a slight advantage of around 21%-27%; D: Decision-curve analysis for 24-month mortality. The HE-global extension (M1b) provides a small net-benefit gain over approximately 8%-23%; HE-segment-VI (M1a) overlaps the reference model.
- Citation: Stanciu BI, Iojiban M, Morariu-Barb A, Caraiani C, Procopet B, Stefanescu H, Lupsor-Platon M. Hepatic enhancement and signal intensity analysis on magnetic resonance imaging as prognostic biomarkers in advanced chronic liver disease. World J Hepatol 2025; 17(12): 111418
- URL: https://www.wjgnet.com/1948-5182/full/v17/i12/111418.htm
- DOI: https://dx.doi.org/10.4254/wjh.v17.i12.111418