
















©The Author(s) 2025.
World J Hepatol. Dec 27, 2025; 17(12): 111418
Published online Dec 27, 2025. doi: 10.4254/wjh.v17.i12.111418
Published online Dec 27, 2025. doi: 10.4254/wjh.v17.i12.111418
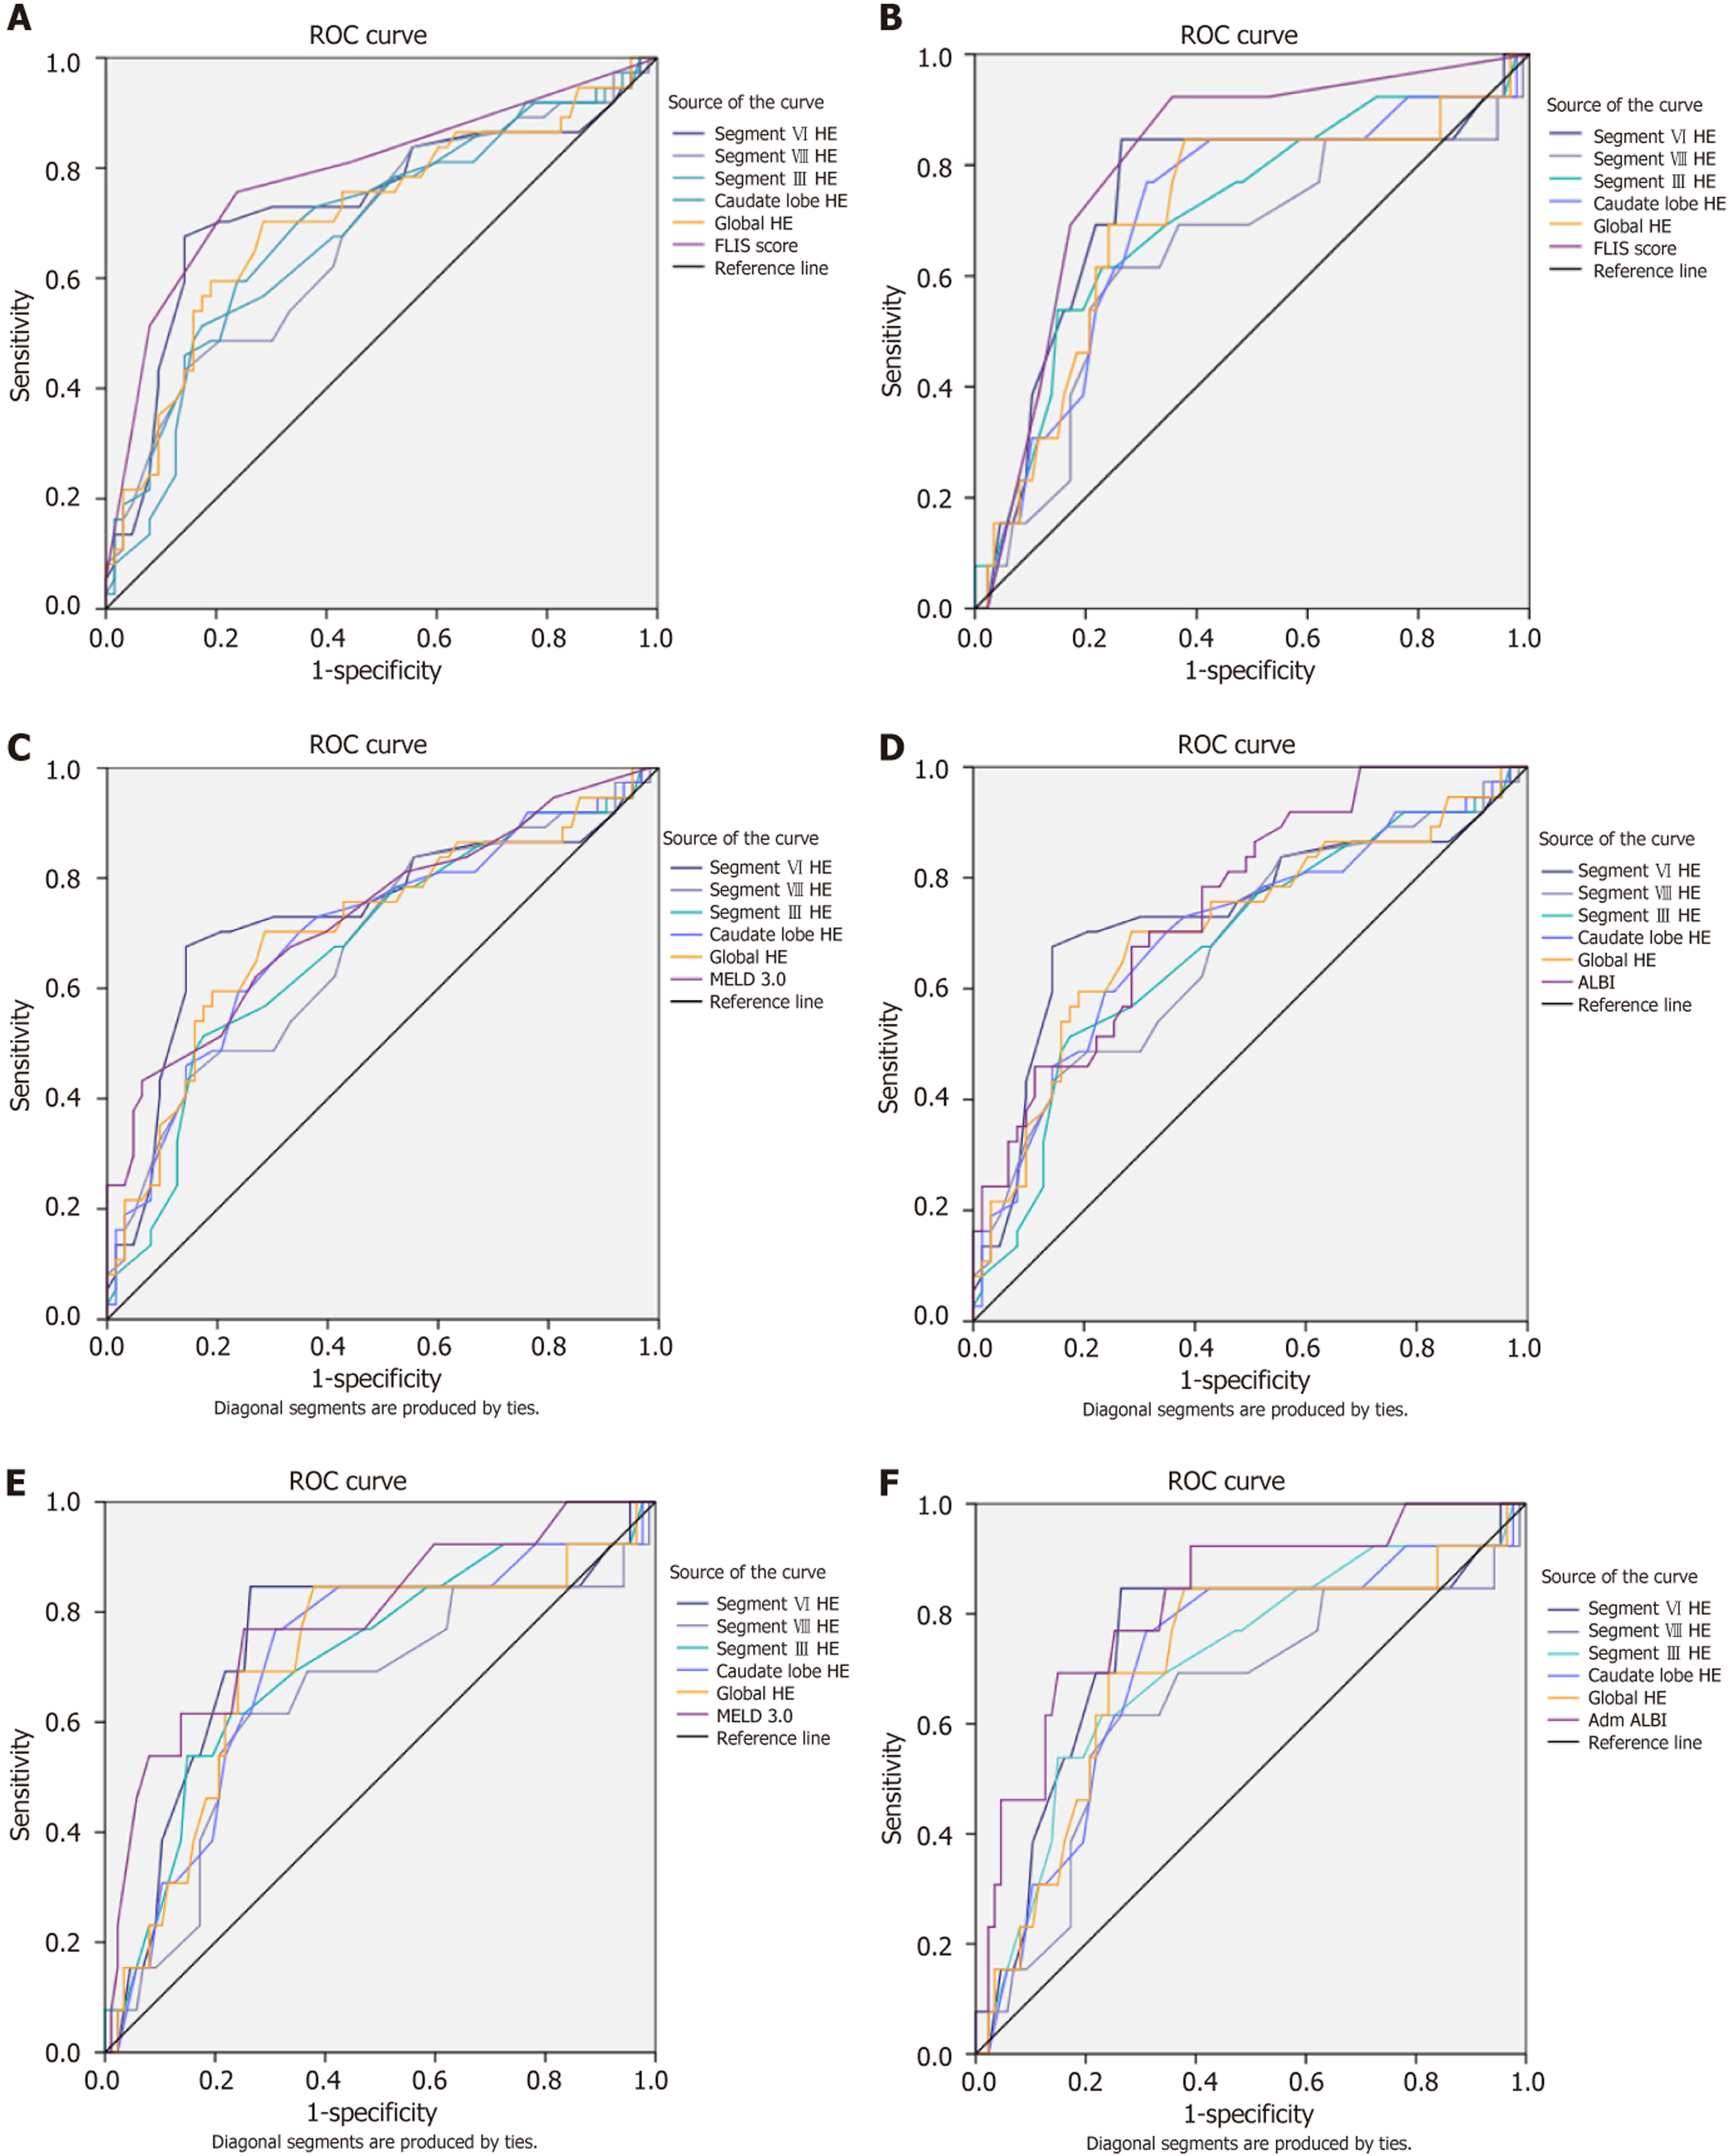
Figure 6 Receiver operating characteristic curves.
A and B: Receiver operating characteristic curves comparing the diagnostic performance of hepatic enhancement (HE) and Functional Liver Imaging Score (FLIS) for predicting outcomes during follow-up. A: Receiver operating characteristic (ROC) curves for decompensation. FLIS achieved the highest discriminatory accuracy, with an area under the receiver operating characteristic curve (AUC) of 0.79 (95% confidence interval [CI]: 0.69-0.88). Among HE measures, segment VI performed best, with an AUC of 0.74 (95%CI: 0.62-0.85). In direct comparisons, most HE measures were significantly less accurate than FLIS, although segment VI showed no significant difference (ΔAUC = -0.05, q = 0.123); B: ROC curves for mortality. FLIS achieved the highest discriminatory performance (AUC = 0.81, 95%CI: 0.69-0.93). Among HE measures, segment VI again performed best (AUC = 0.74, 95%CI: 0.57-0.91). In direct comparisons, segment VI HE did not differ significantly from either FLIS (ΔAUC = -0.07, q = 0.293), while segment VIII HE was significantly inferior to FLIS (ΔAUC = -0.18, q = 0.025); C-F: ROC curves comparing the diagnostic performance of HE, Model for End-Stage Liver Disease (MELD) 3.0, and albumin-bilirubin (ALBI) score for predicting outcomes during follow-up. C: ROC curves comparing HE and MELD 3.0 ability to discriminate for decompensation. MELD 3.0 (AUC = 0.73, 95%CI: 0.63-0.83) slightly outperformed most HE parameters, with ΔAUC values from -0.05 to 0.01. However, these differences were not statistically significant, and segment VI performed closest to both scores; D: ROC curves comparing HE and MELD 3.0 abilities to discriminate mortality. Among HE measures, segment VI performed best (AUC = 0.74, 95%CI: 0.57-0.91). MELD 3.0 performed similarly to HE (AUC = 0.79, 95%CI: 0.64-0.94), with ΔAUC values for segment VI vs MELD not being significant; E: ROC curves comparing HE and ALBI ability to discriminate for decompensation. ALBI (AUC = 0.77, 95%CI: 0.67-0.86) slightly outperformed most HE parameters, with ΔAUC values from -0.09 to -0.04. However, these differences were not statistically significant; F: ROC curves comparing HE and ALBI in their ability to discriminate mortality. Overall, ALBI proved to be the most accurate score for mortality (AUC = 0.82, 95%CI: 0.69-0.95). However, HE - particularly segment VI - maintained a strong discriminative ability and a very high negative predictive value (0.97).
- Citation: Stanciu BI, Iojiban M, Morariu-Barb A, Caraiani C, Procopet B, Stefanescu H, Lupsor-Platon M. Hepatic enhancement and signal intensity analysis on magnetic resonance imaging as prognostic biomarkers in advanced chronic liver disease. World J Hepatol 2025; 17(12): 111418
- URL: https://www.wjgnet.com/1948-5182/full/v17/i12/111418.htm
- DOI: https://dx.doi.org/10.4254/wjh.v17.i12.111418