
















©The Author(s) 2025.
World J Hepatol. Dec 27, 2025; 17(12): 111418
Published online Dec 27, 2025. doi: 10.4254/wjh.v17.i12.111418
Published online Dec 27, 2025. doi: 10.4254/wjh.v17.i12.111418
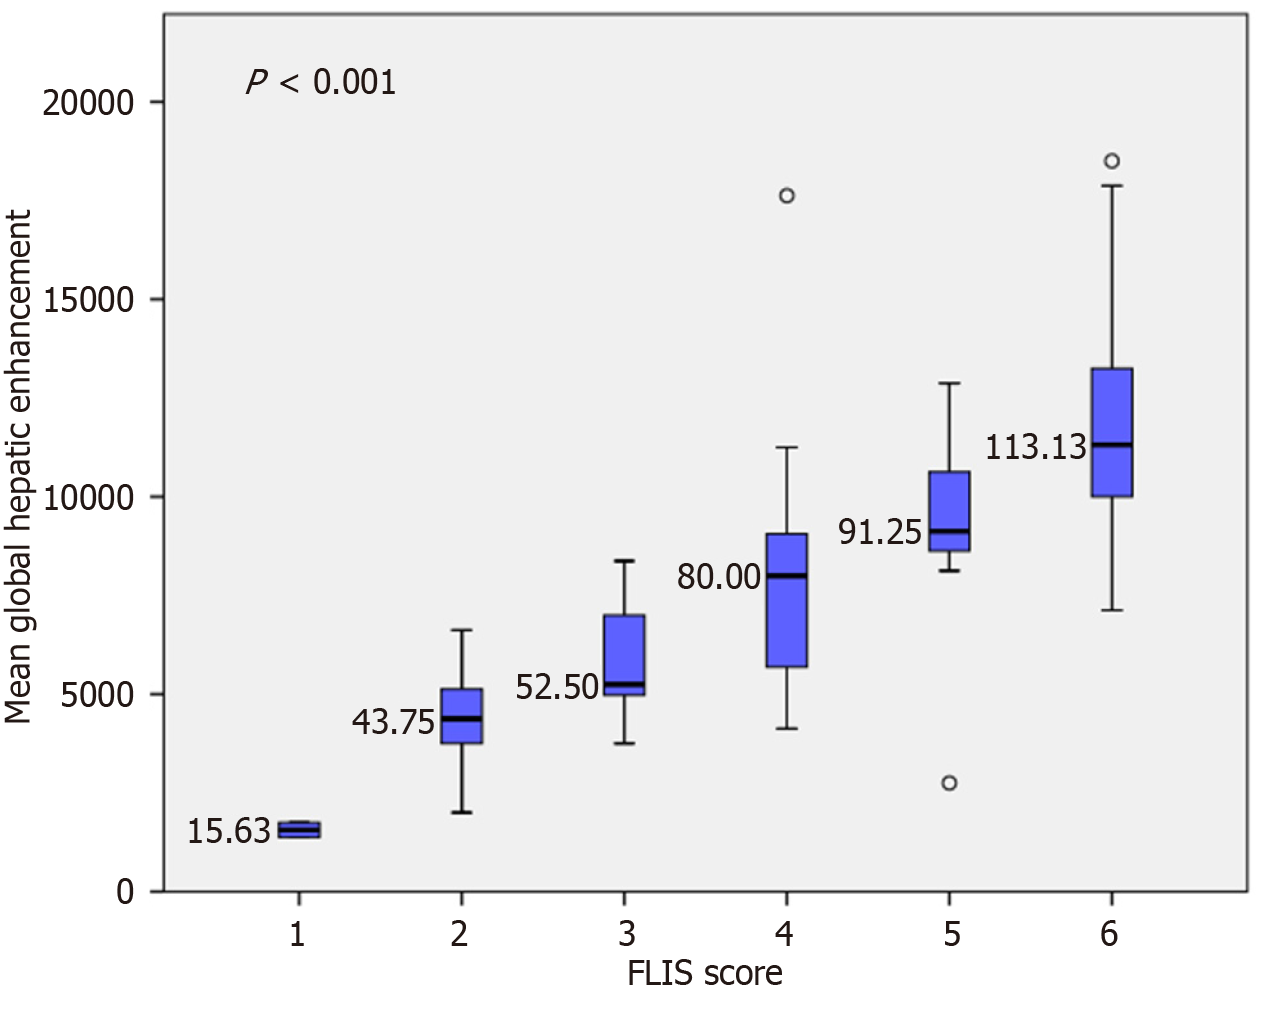
Figure 5 Variation in mean global hepatic enhancement according to the Functional Liver Imaging Score.
Box plots illustrate a progressive increase in global hepatic enhancement with a higher Functional Liver Imaging Score (FLIS) (F = 28.06, P < 0.001). Tukey’s honest significant difference post hoc analysis confirmed significant differences between lower and higher FLIS groups (e.g., FLIS 1-3 vs FLIS 4-6). However, no significant differences were observed between adjacent categories, such as FLIS 1 vs 2 and FLIS 2 vs 3.
- Citation: Stanciu BI, Iojiban M, Morariu-Barb A, Caraiani C, Procopet B, Stefanescu H, Lupsor-Platon M. Hepatic enhancement and signal intensity analysis on magnetic resonance imaging as prognostic biomarkers in advanced chronic liver disease. World J Hepatol 2025; 17(12): 111418
- URL: https://www.wjgnet.com/1948-5182/full/v17/i12/111418.htm
- DOI: https://dx.doi.org/10.4254/wjh.v17.i12.111418