
















©The Author(s) 2025.
World J Hepatol. Dec 27, 2025; 17(12): 111418
Published online Dec 27, 2025. doi: 10.4254/wjh.v17.i12.111418
Published online Dec 27, 2025. doi: 10.4254/wjh.v17.i12.111418
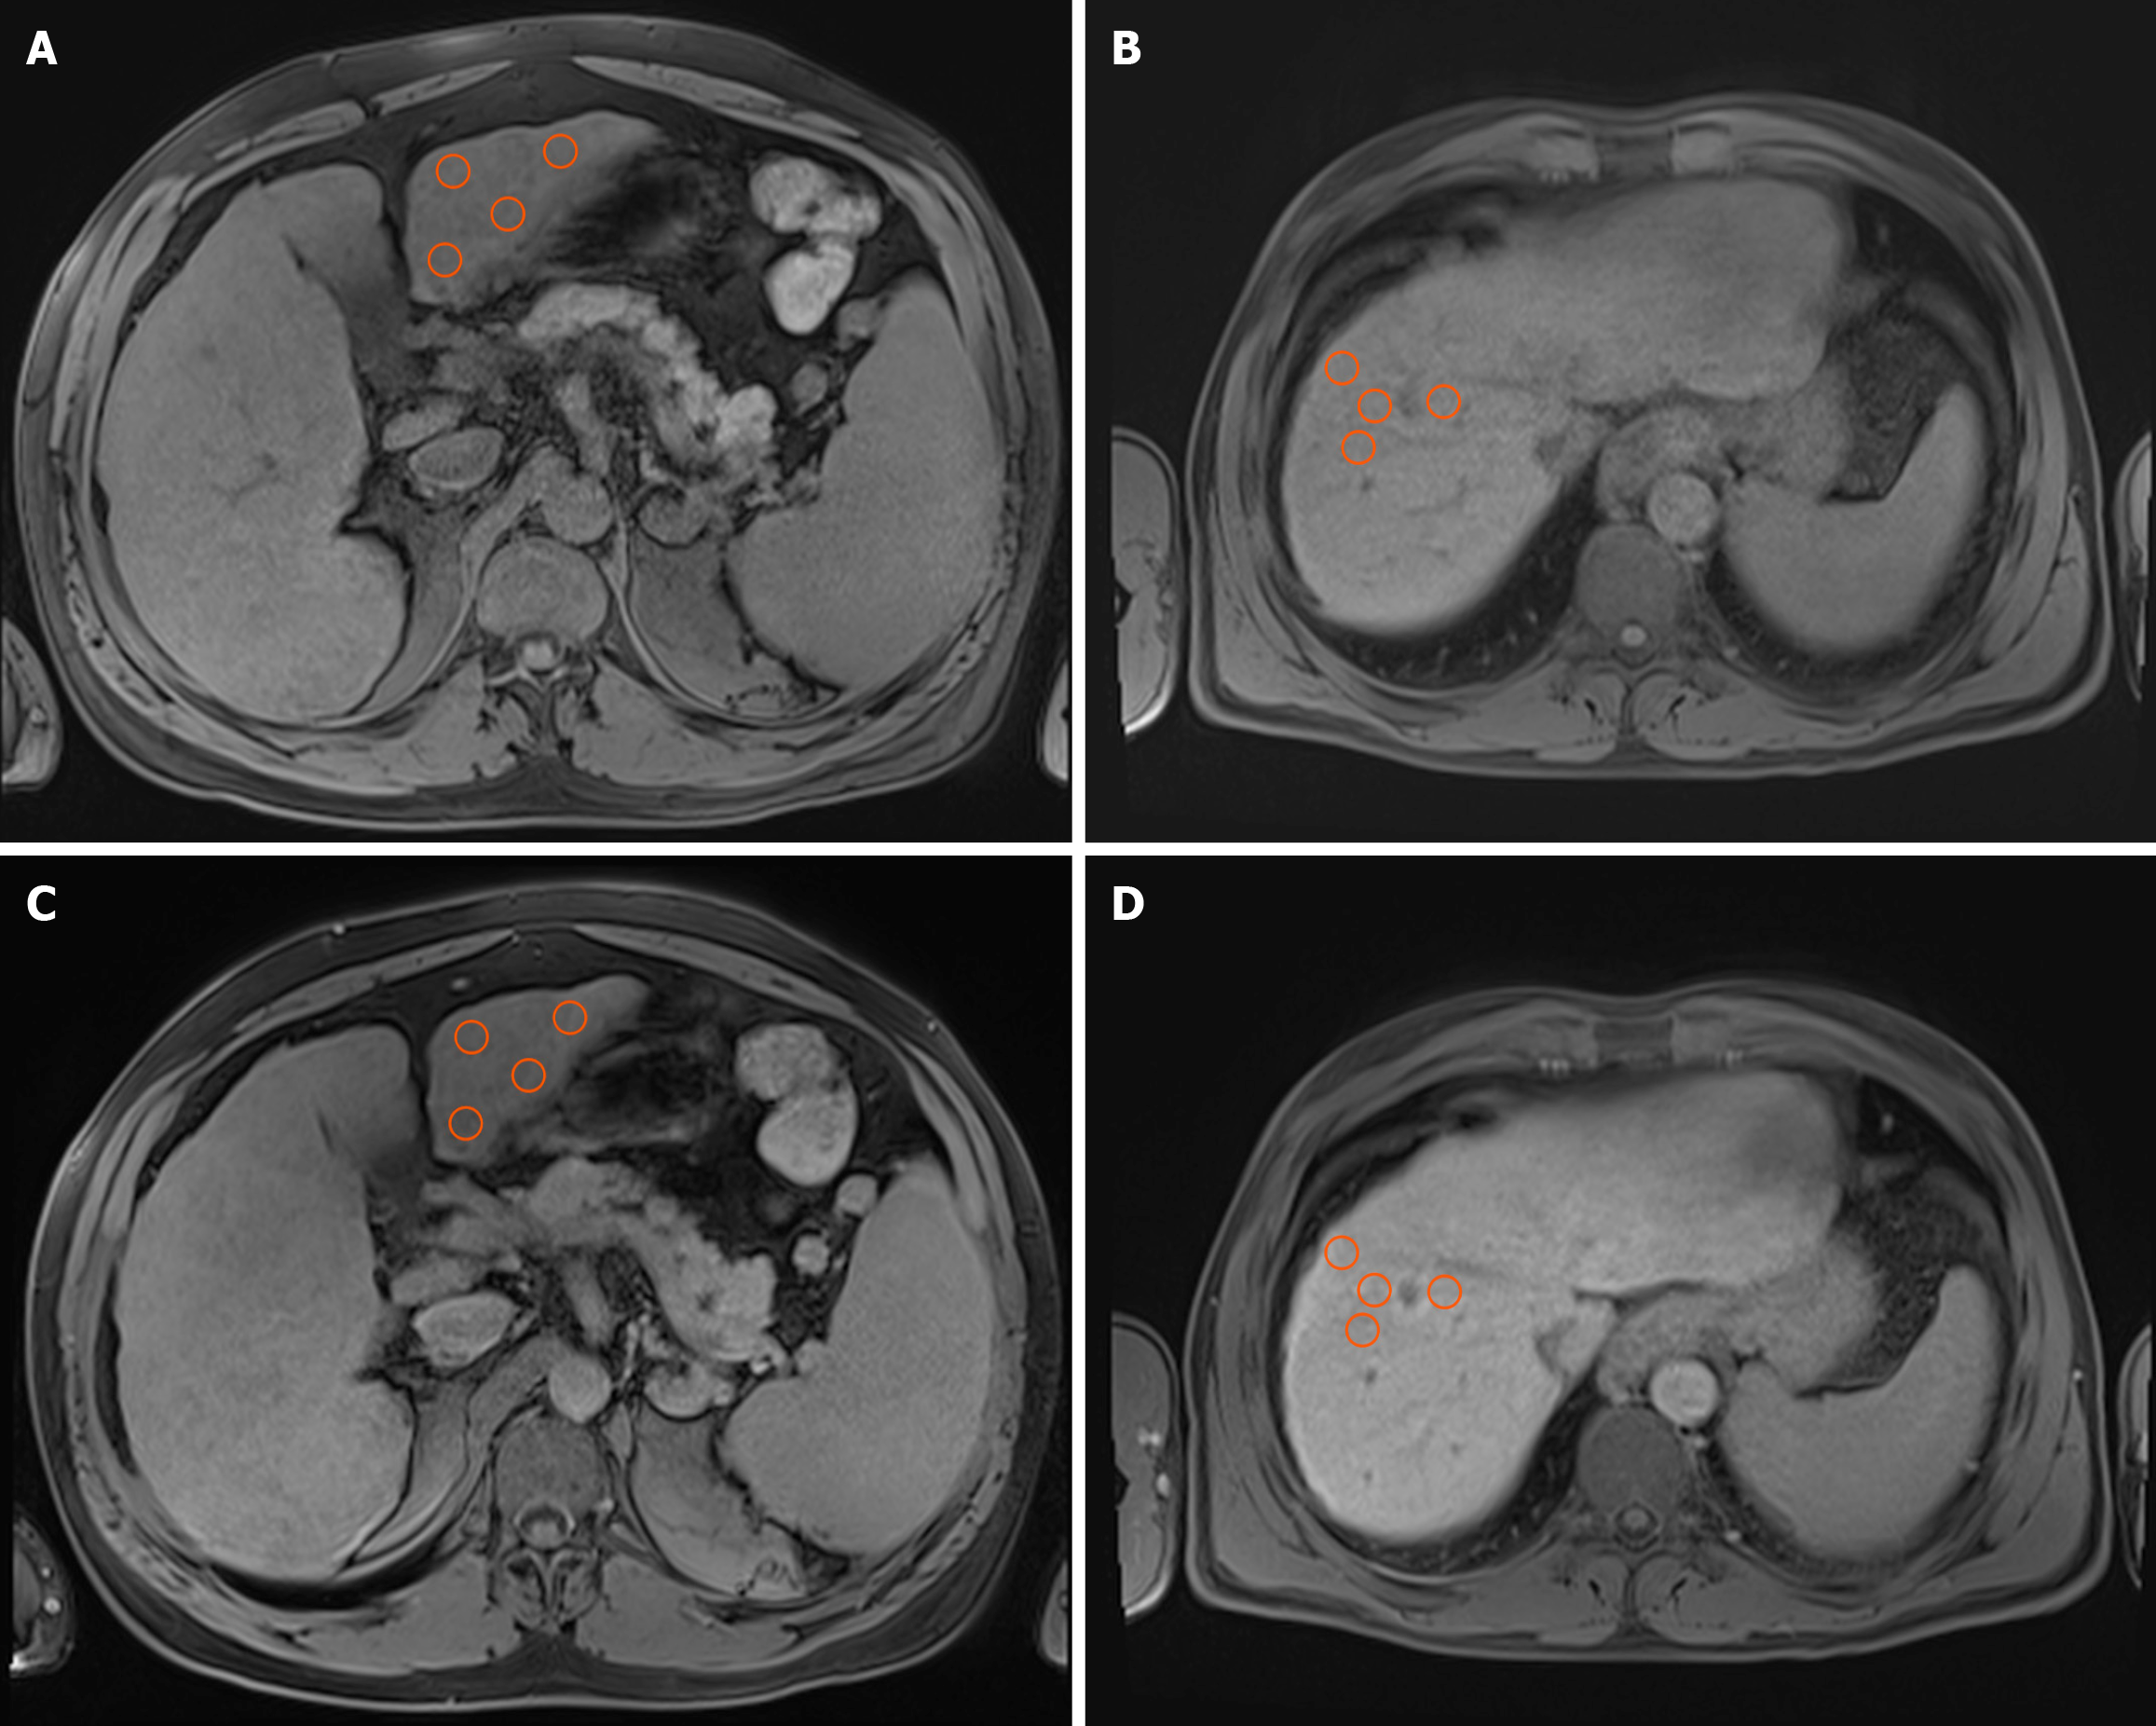
Figure 1 Illustration of signal intensity measurement methodology on axial T1-weighted volumetric interpolated breath-hold examination images with fat suppression, acquired during the native and hepatobiliary phases.
A and B: The native phases; C and D: The hepatobiliary phases. Images A and C depict signal intensity measurements in segment III, whereas images B and D demonstrate the same technique applied to segment VIII. Orange circles represent four manually positioned circular regions of interest, each spanning 1 cm2, situated within homogeneous liver parenchyma. The regions of interest were consistently replicated in identical locations across the two phases to ensure precise and comparable signal intensity evaluation.
- Citation: Stanciu BI, Iojiban M, Morariu-Barb A, Caraiani C, Procopet B, Stefanescu H, Lupsor-Platon M. Hepatic enhancement and signal intensity analysis on magnetic resonance imaging as prognostic biomarkers in advanced chronic liver disease. World J Hepatol 2025; 17(12): 111418
- URL: https://www.wjgnet.com/1948-5182/full/v17/i12/111418.htm
- DOI: https://dx.doi.org/10.4254/wjh.v17.i12.111418