
















©The Author(s) 2025.
World J Hepatol. Nov 27, 2025; 17(11): 112364
Published online Nov 27, 2025. doi: 10.4254/wjh.v17.i11.112364
Published online Nov 27, 2025. doi: 10.4254/wjh.v17.i11.112364
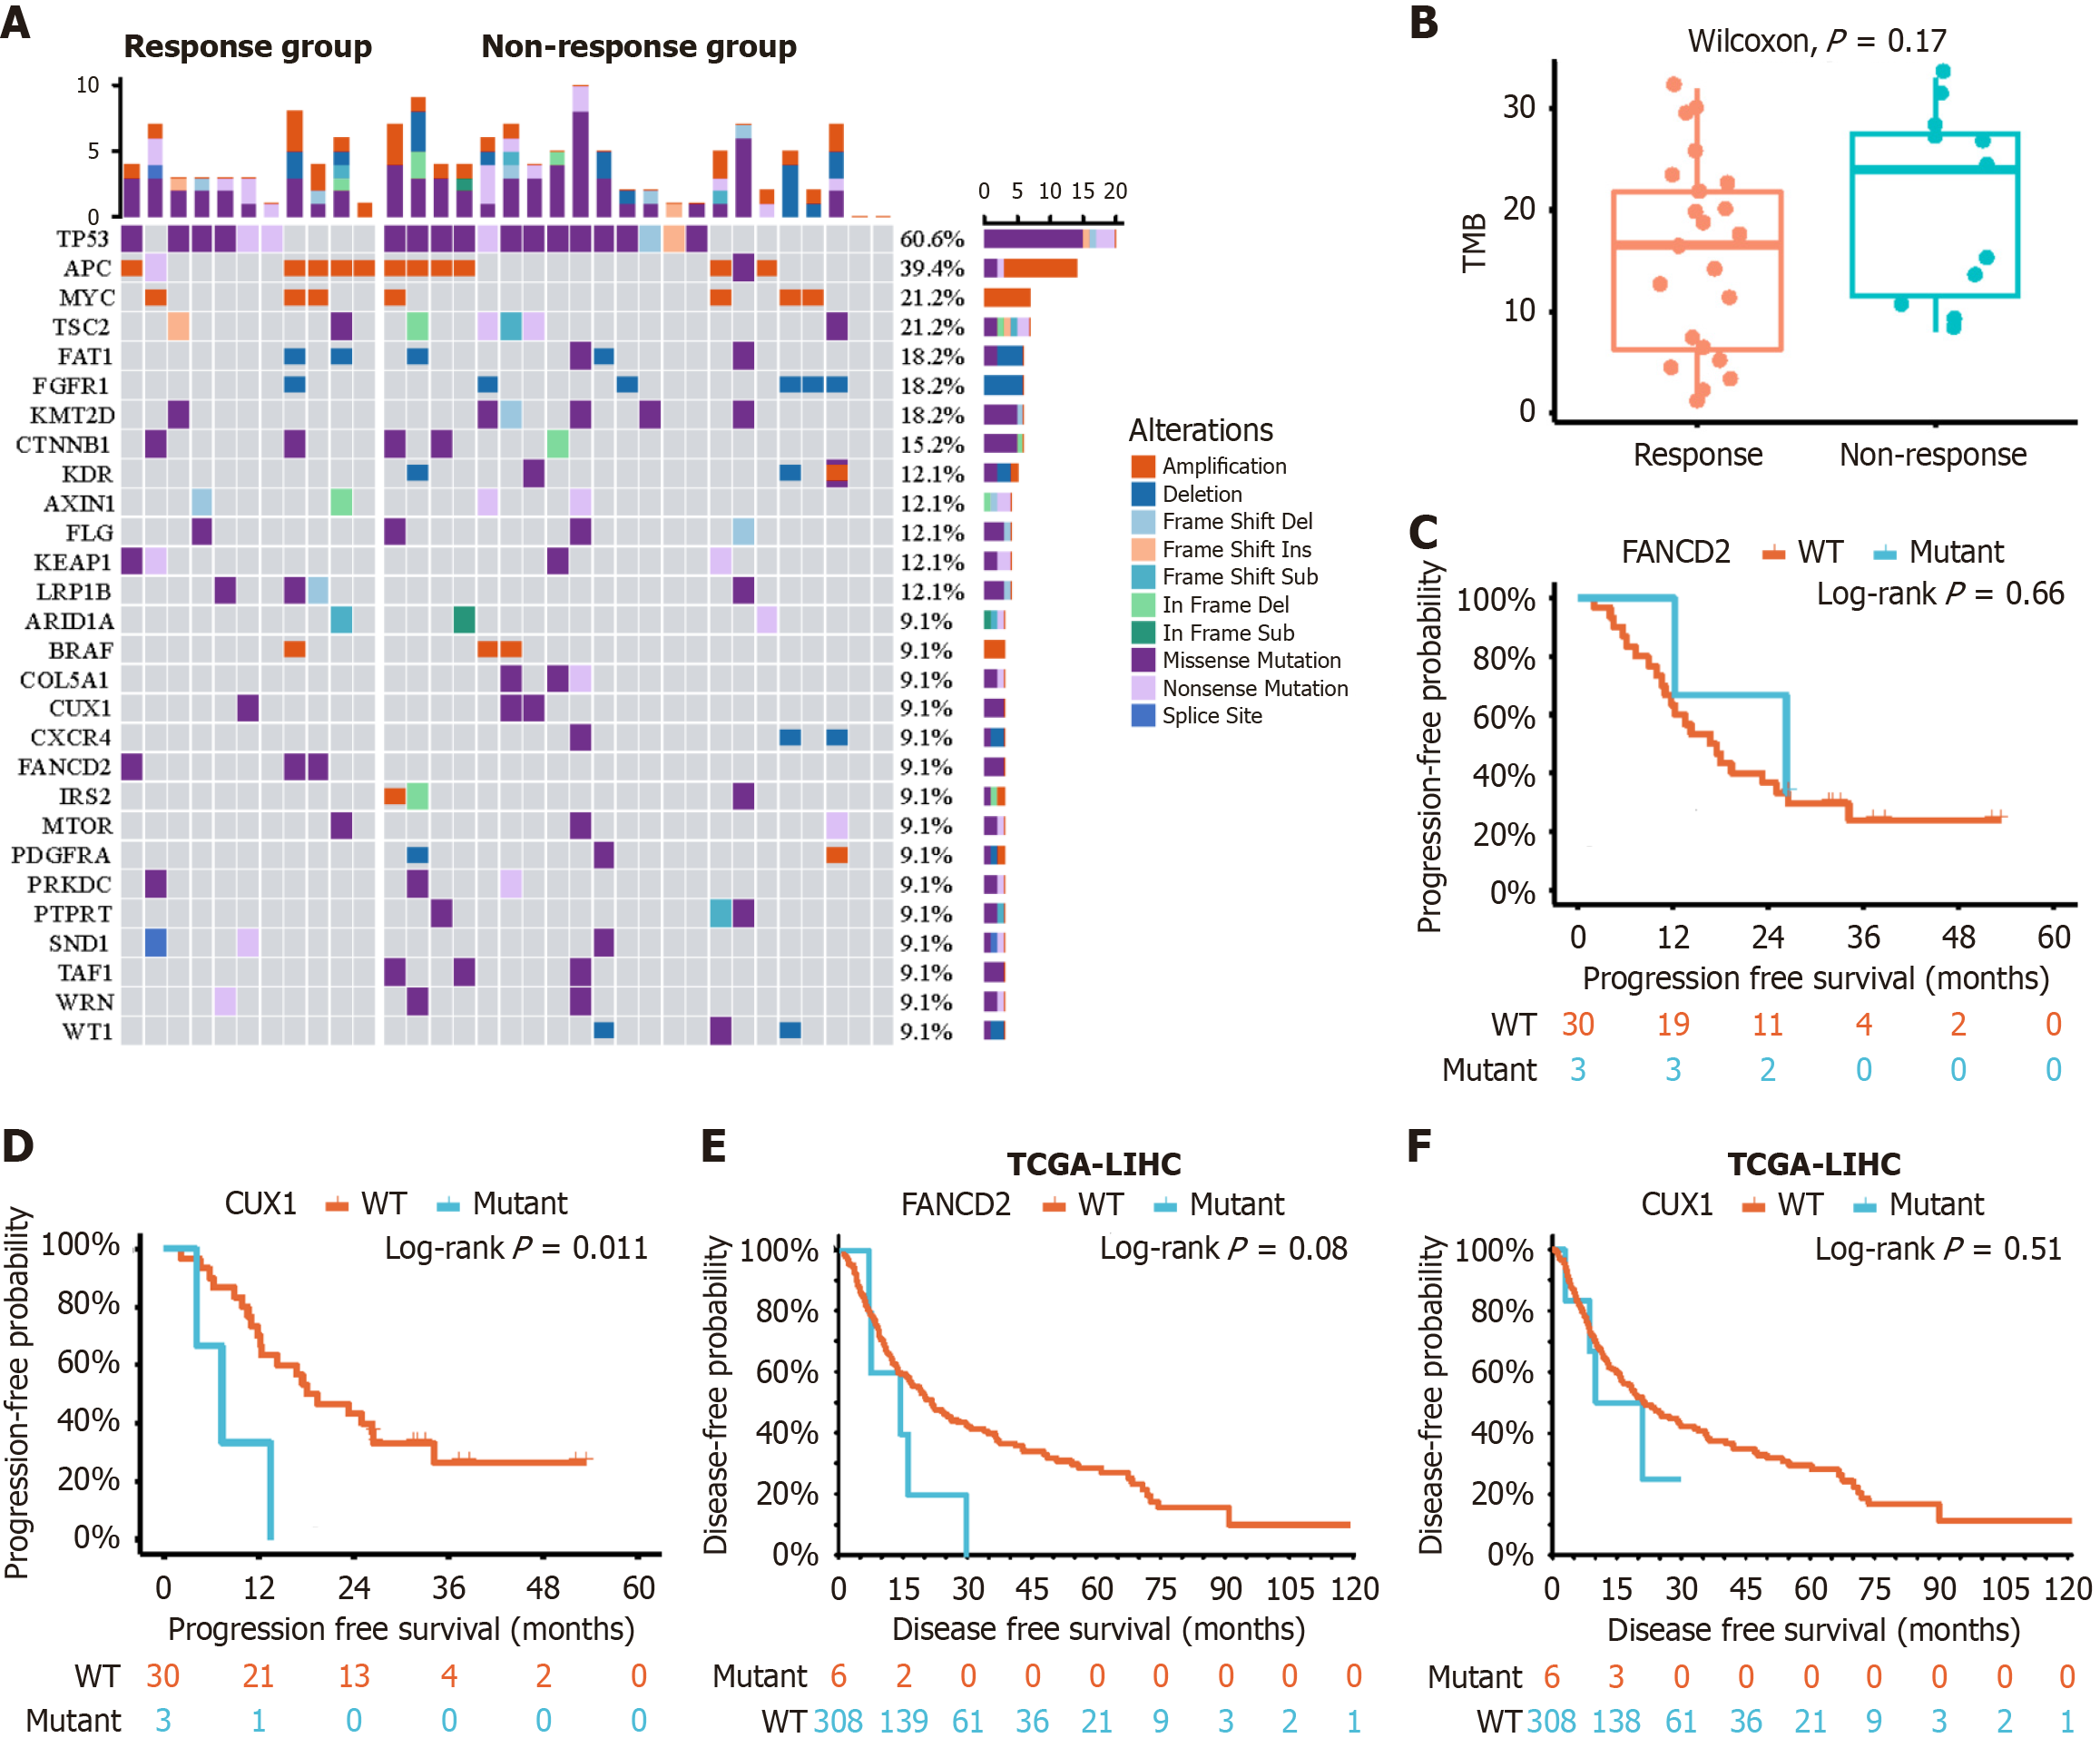
Figure 4 Mutational landscape and survival analysis.
A: Oncoplot illustrating mutations detected by whole exome sequencing; B: Boxplots depicting comparisons of tumor mutational burden between the response group and the non-response group; C and D: Kaplan-Meier curves for survival analysis based on mutations in Fanconi anemia complementation group D2 (C) and cut-like homeobox 1 (D) within the study population; E and F: Kaplan-Meier curves for survival analysis for mutations in Fanconi anemia complementation group D2 (E) and cut-like homeobox 1 (F), utilizing data derived from The Cancer Genome Atlas. FANCD2: Fanconi anemia complementation group D2; WT: Wild type; CUX1: Cut-like homeobox 1; TCGA: The Cancer Genome Atlas; LIHC: Liver hepatocellular carcinoma.
- Citation: Wang LJ, Cui Y, Huang LF, Zhang JQ, Zhao TT, Wang HW, Liu M, Jin KM, Wang K, Xing BC. Molecular biomarkers of sintilimab plus lenvatinib in hepatitis-B-virus-associated hepatocellular carcinoma. World J Hepatol 2025; 17(11): 112364
- URL: https://www.wjgnet.com/1948-5182/full/v17/i11/112364.htm
- DOI: https://dx.doi.org/10.4254/wjh.v17.i11.112364