
















©The Author(s) 2025.
World J Hepatol. Nov 27, 2025; 17(11): 110698
Published online Nov 27, 2025. doi: 10.4254/wjh.v17.i11.110698
Published online Nov 27, 2025. doi: 10.4254/wjh.v17.i11.110698
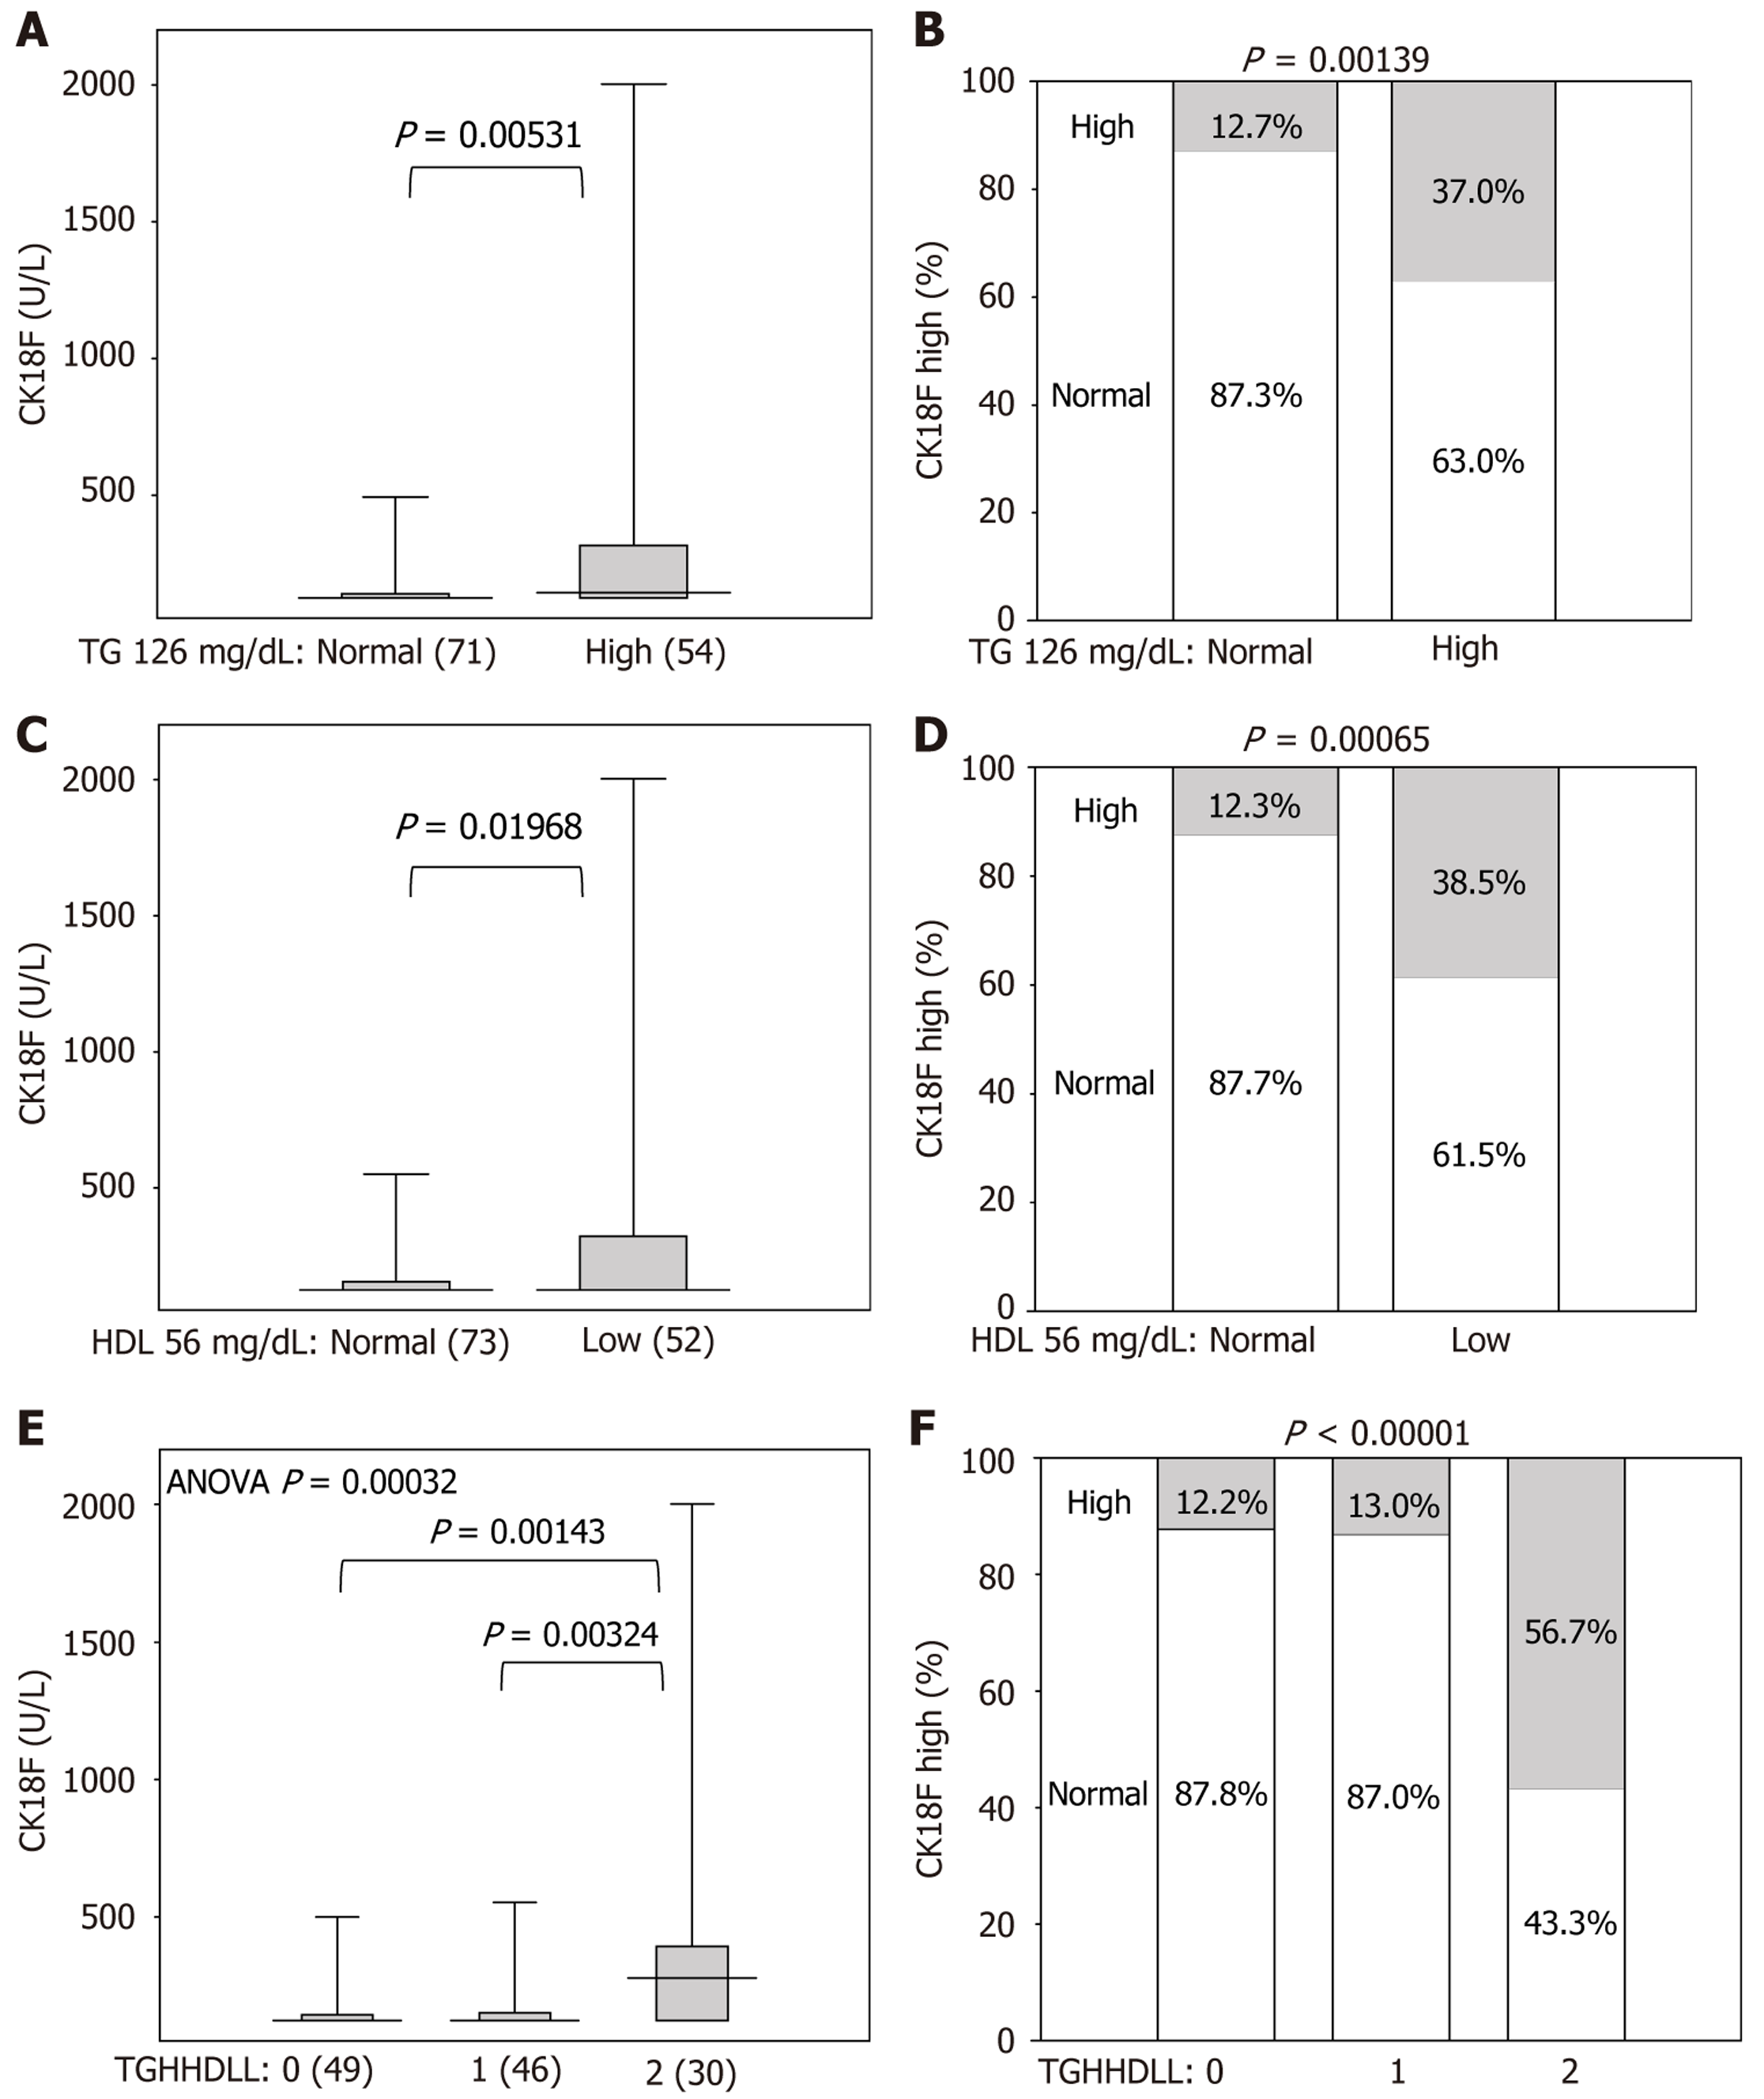
Figure 3 Triglycerides and high-density lipoprotein influenced cytokeratin 18 fragment levels.
A: High triglycerides (TGs) were > 126 mg/dL. Figures in brackets were the number of patients. P value for the Mann–Whitney U test is indicated in the figure. Y axis is cytokeratin 18 fragment (CK18F) (U/L); B: High CK18F rate in the normal and high TG groups. P value for the χ2 test is shown in the figure; C: Low high-density lipoprotein (HDL) group with values < 56 mg/dL; D: High CK18F rate in the normal and low HDL groups; E: High TG and low HDL scores were calculated with high TG as 1 point and low HDL as 1 point. P value for the analysis of variance test is shown on the figure. P values between groups for the Dunn test; F: High CK18F rate for high TG and low HDL score. ANOVA: Analysis of variance; TGHHDLL: Triglycerides high (> 126 mg/dL) and high-density lipoprotein low (≤ 56 mg/dL).
- Citation: Ichikawa T, Miuma S, Yamashima M, Yamamichi S, Koike M, Nakano Y, Yajima H, Miyazaki O, Ikeda T, Okamura T, Komatsu N, Yoshino M, Miyaaki H. Cytokeratin 18 fragment is associated with steatosis-associated fibrosis estimator score and lipid in patients with steatotic liver disease. World J Hepatol 2025; 17(11): 110698
- URL: https://www.wjgnet.com/1948-5182/full/v17/i11/110698.htm
- DOI: https://dx.doi.org/10.4254/wjh.v17.i11.110698