
















©The Author(s) 2025.
World J Hepatol. Nov 27, 2025; 17(11): 110698
Published online Nov 27, 2025. doi: 10.4254/wjh.v17.i11.110698
Published online Nov 27, 2025. doi: 10.4254/wjh.v17.i11.110698
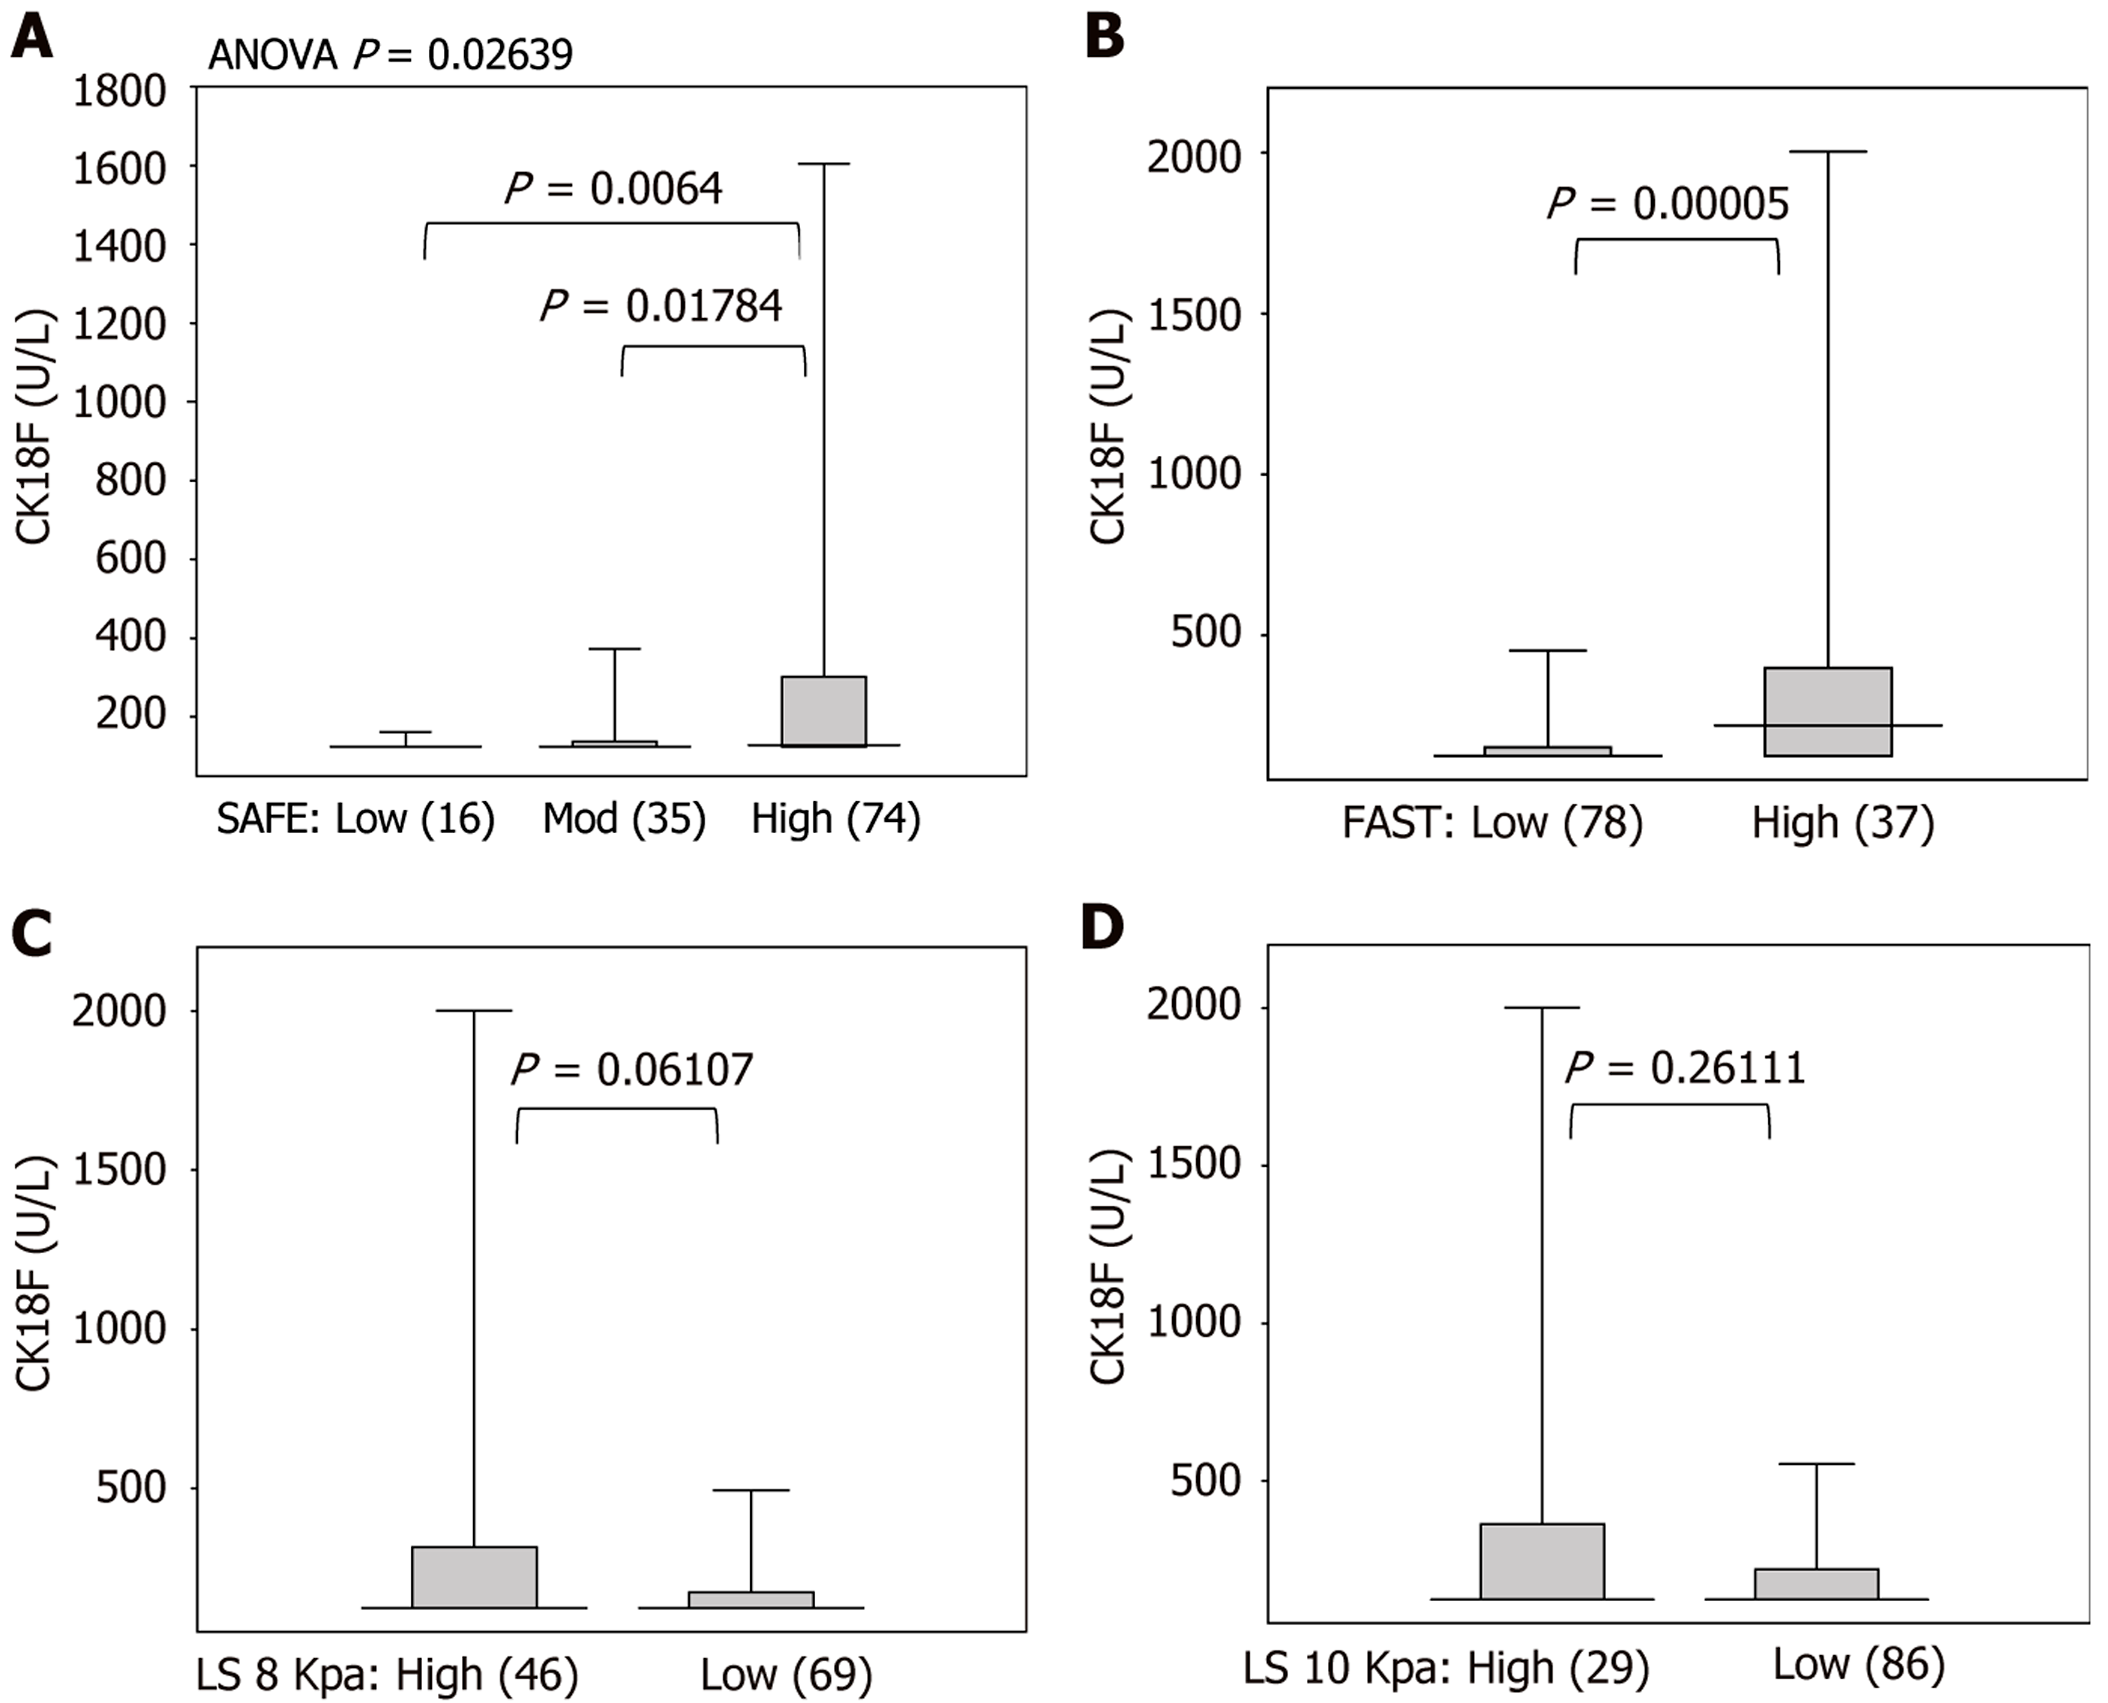
Figure 2 Relationship between severity classification according to non-invasive test and cytokeratin 18 fragment values.
A: Classification according to steatosis-associated fibrosis estimator score. P value for analysis of variance is indicted in the figure. Cytokeratin 18 fragment (CK18F) was higher in the high group than those in the low and moderate groups (Dunn test); B: Classification according to FibroScan-aspartate aminotransferase score. P value for the Mann–Whitney U test is indicated in the figure; C: Classification according to liver stiffness (LS). High LS group is > 8 Kpa; D: High LS group is > 10 Kpa. Y axis is CK18F (U/L). ANOVA: Analysis of variance; SAFE: Steatosis associated fibrosis estimator; FAST: FibroScan-aspartate aminotransferase.
- Citation: Ichikawa T, Miuma S, Yamashima M, Yamamichi S, Koike M, Nakano Y, Yajima H, Miyazaki O, Ikeda T, Okamura T, Komatsu N, Yoshino M, Miyaaki H. Cytokeratin 18 fragment is associated with steatosis-associated fibrosis estimator score and lipid in patients with steatotic liver disease. World J Hepatol 2025; 17(11): 110698
- URL: https://www.wjgnet.com/1948-5182/full/v17/i11/110698.htm
- DOI: https://dx.doi.org/10.4254/wjh.v17.i11.110698