
















©The Author(s) 2025.
World J Hepatol. Oct 27, 2025; 17(10): 110856
Published online Oct 27, 2025. doi: 10.4254/wjh.v17.i10.110856
Published online Oct 27, 2025. doi: 10.4254/wjh.v17.i10.110856
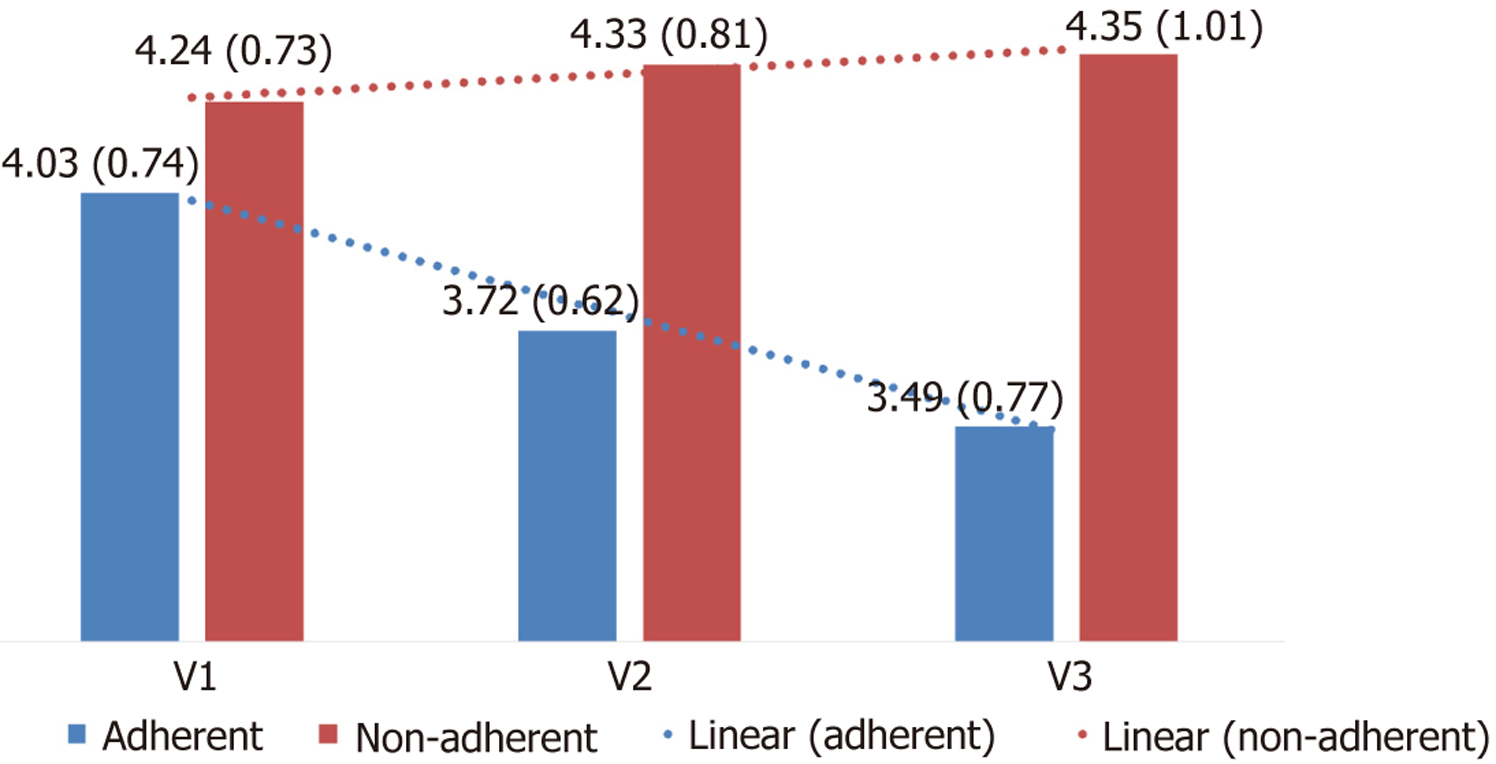
Figure 2 Evolution of Liver Frailty Index scores over time in adherent and non-adherent participants.
Bar graphs represent mean Liver Frailty Index values with standard deviations at each study visit (V1, V2, and V3). The adherent group demonstrated a progressive reduction in frailty scores across visits, while the non-adherent group showed a slight increase. Dotted lines indicate the linear trend for each group.
- Citation: Loschi TM, Baccan MDTA, Pereira EC, Dellabarba TDLC, Boteon APCS, Boteon YL. Telerehabilitation for frail cirrhotic patients awaiting liver transplant: A safe, effective strategy to improve outcomes. World J Hepatol 2025; 17(10): 110856
- URL: https://www.wjgnet.com/1948-5182/full/v17/i10/110856.htm
- DOI: https://dx.doi.org/10.4254/wjh.v17.i10.110856