
















©The Author(s) 2025.
World J Hepatol. Oct 27, 2025; 17(10): 110402
Published online Oct 27, 2025. doi: 10.4254/wjh.v17.i10.110402
Published online Oct 27, 2025. doi: 10.4254/wjh.v17.i10.110402
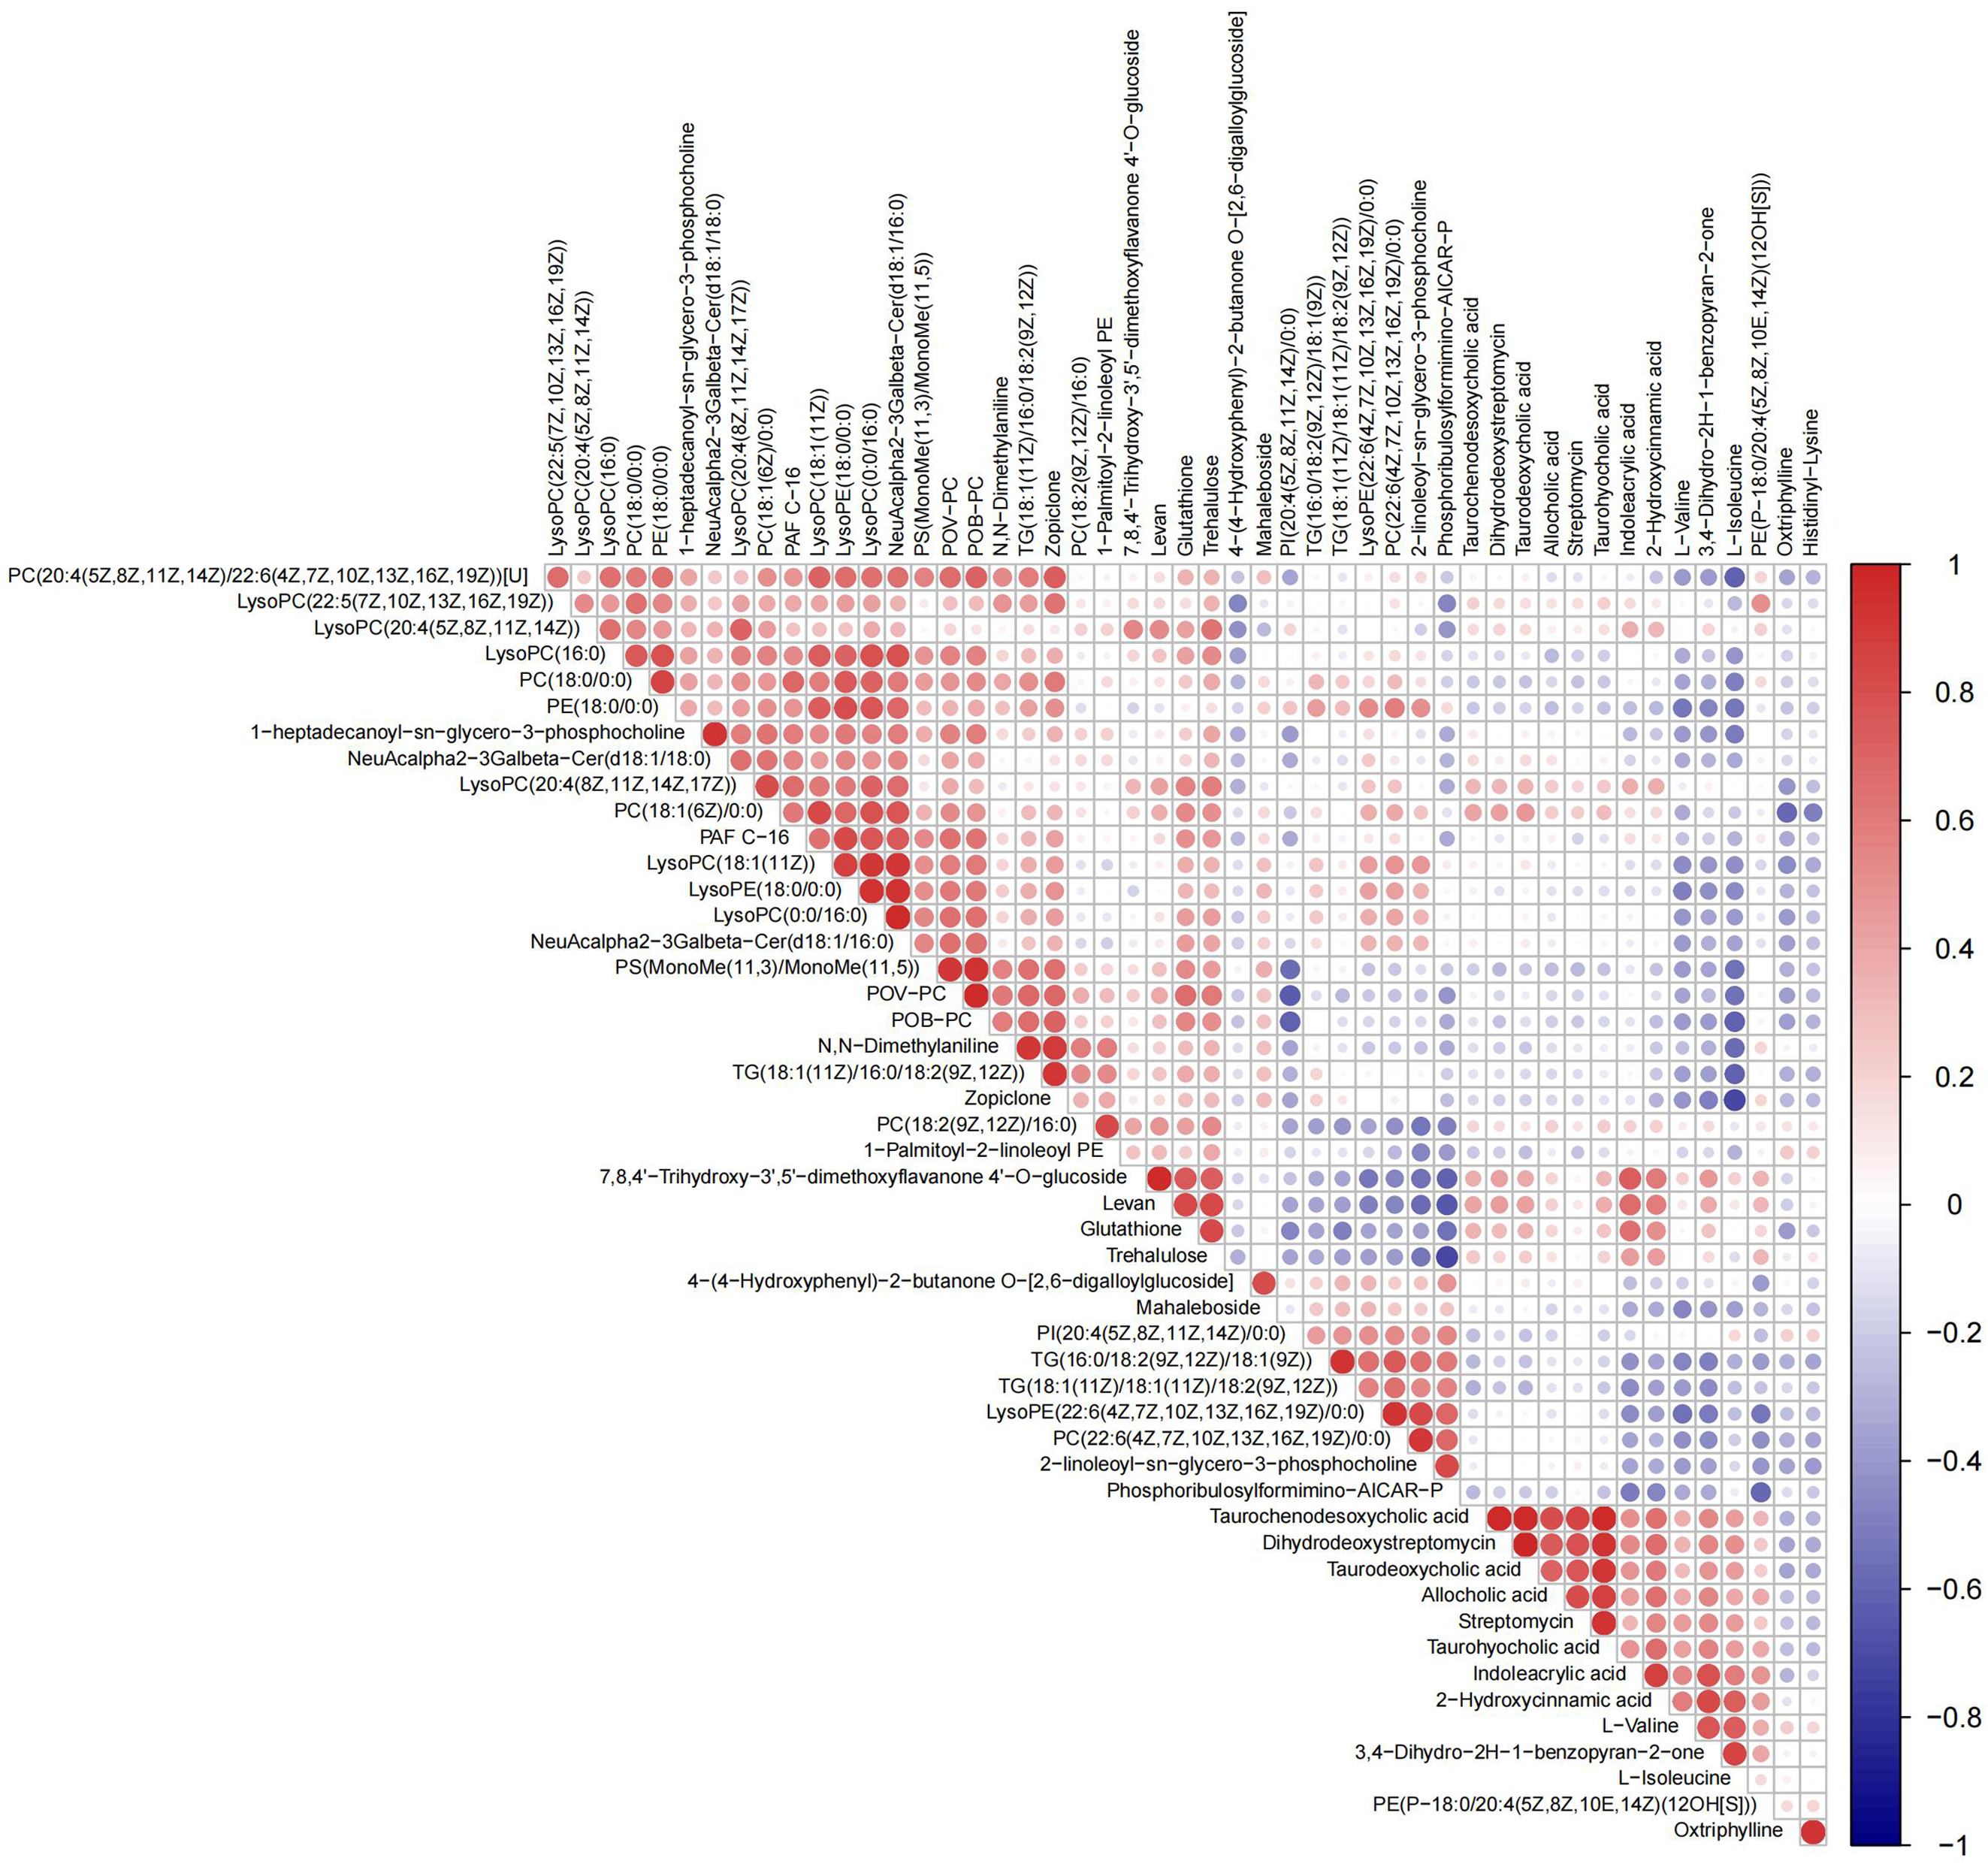
Figure 5 Heatmap pearson correlation analysis for assessing the correlation between different metabolites.
Some metabolites are negatively correlated (blue) and some are positively correlated (red). The darker the colour the stronger the correlation.
- Citation: Niu S, Chen SC, Wang CX, Yue L, Wang SQ. Metabolic and hepatic effects of semaglutide and empagliflozin on metabolic dysfunction-associated steatotic liver disease mice. World J Hepatol 2025; 17(10): 110402
- URL: https://www.wjgnet.com/1948-5182/full/v17/i10/110402.htm
- DOI: https://dx.doi.org/10.4254/wjh.v17.i10.110402