
















©The Author(s) 2025.
World J Hepatol. Oct 27, 2025; 17(10): 110402
Published online Oct 27, 2025. doi: 10.4254/wjh.v17.i10.110402
Published online Oct 27, 2025. doi: 10.4254/wjh.v17.i10.110402
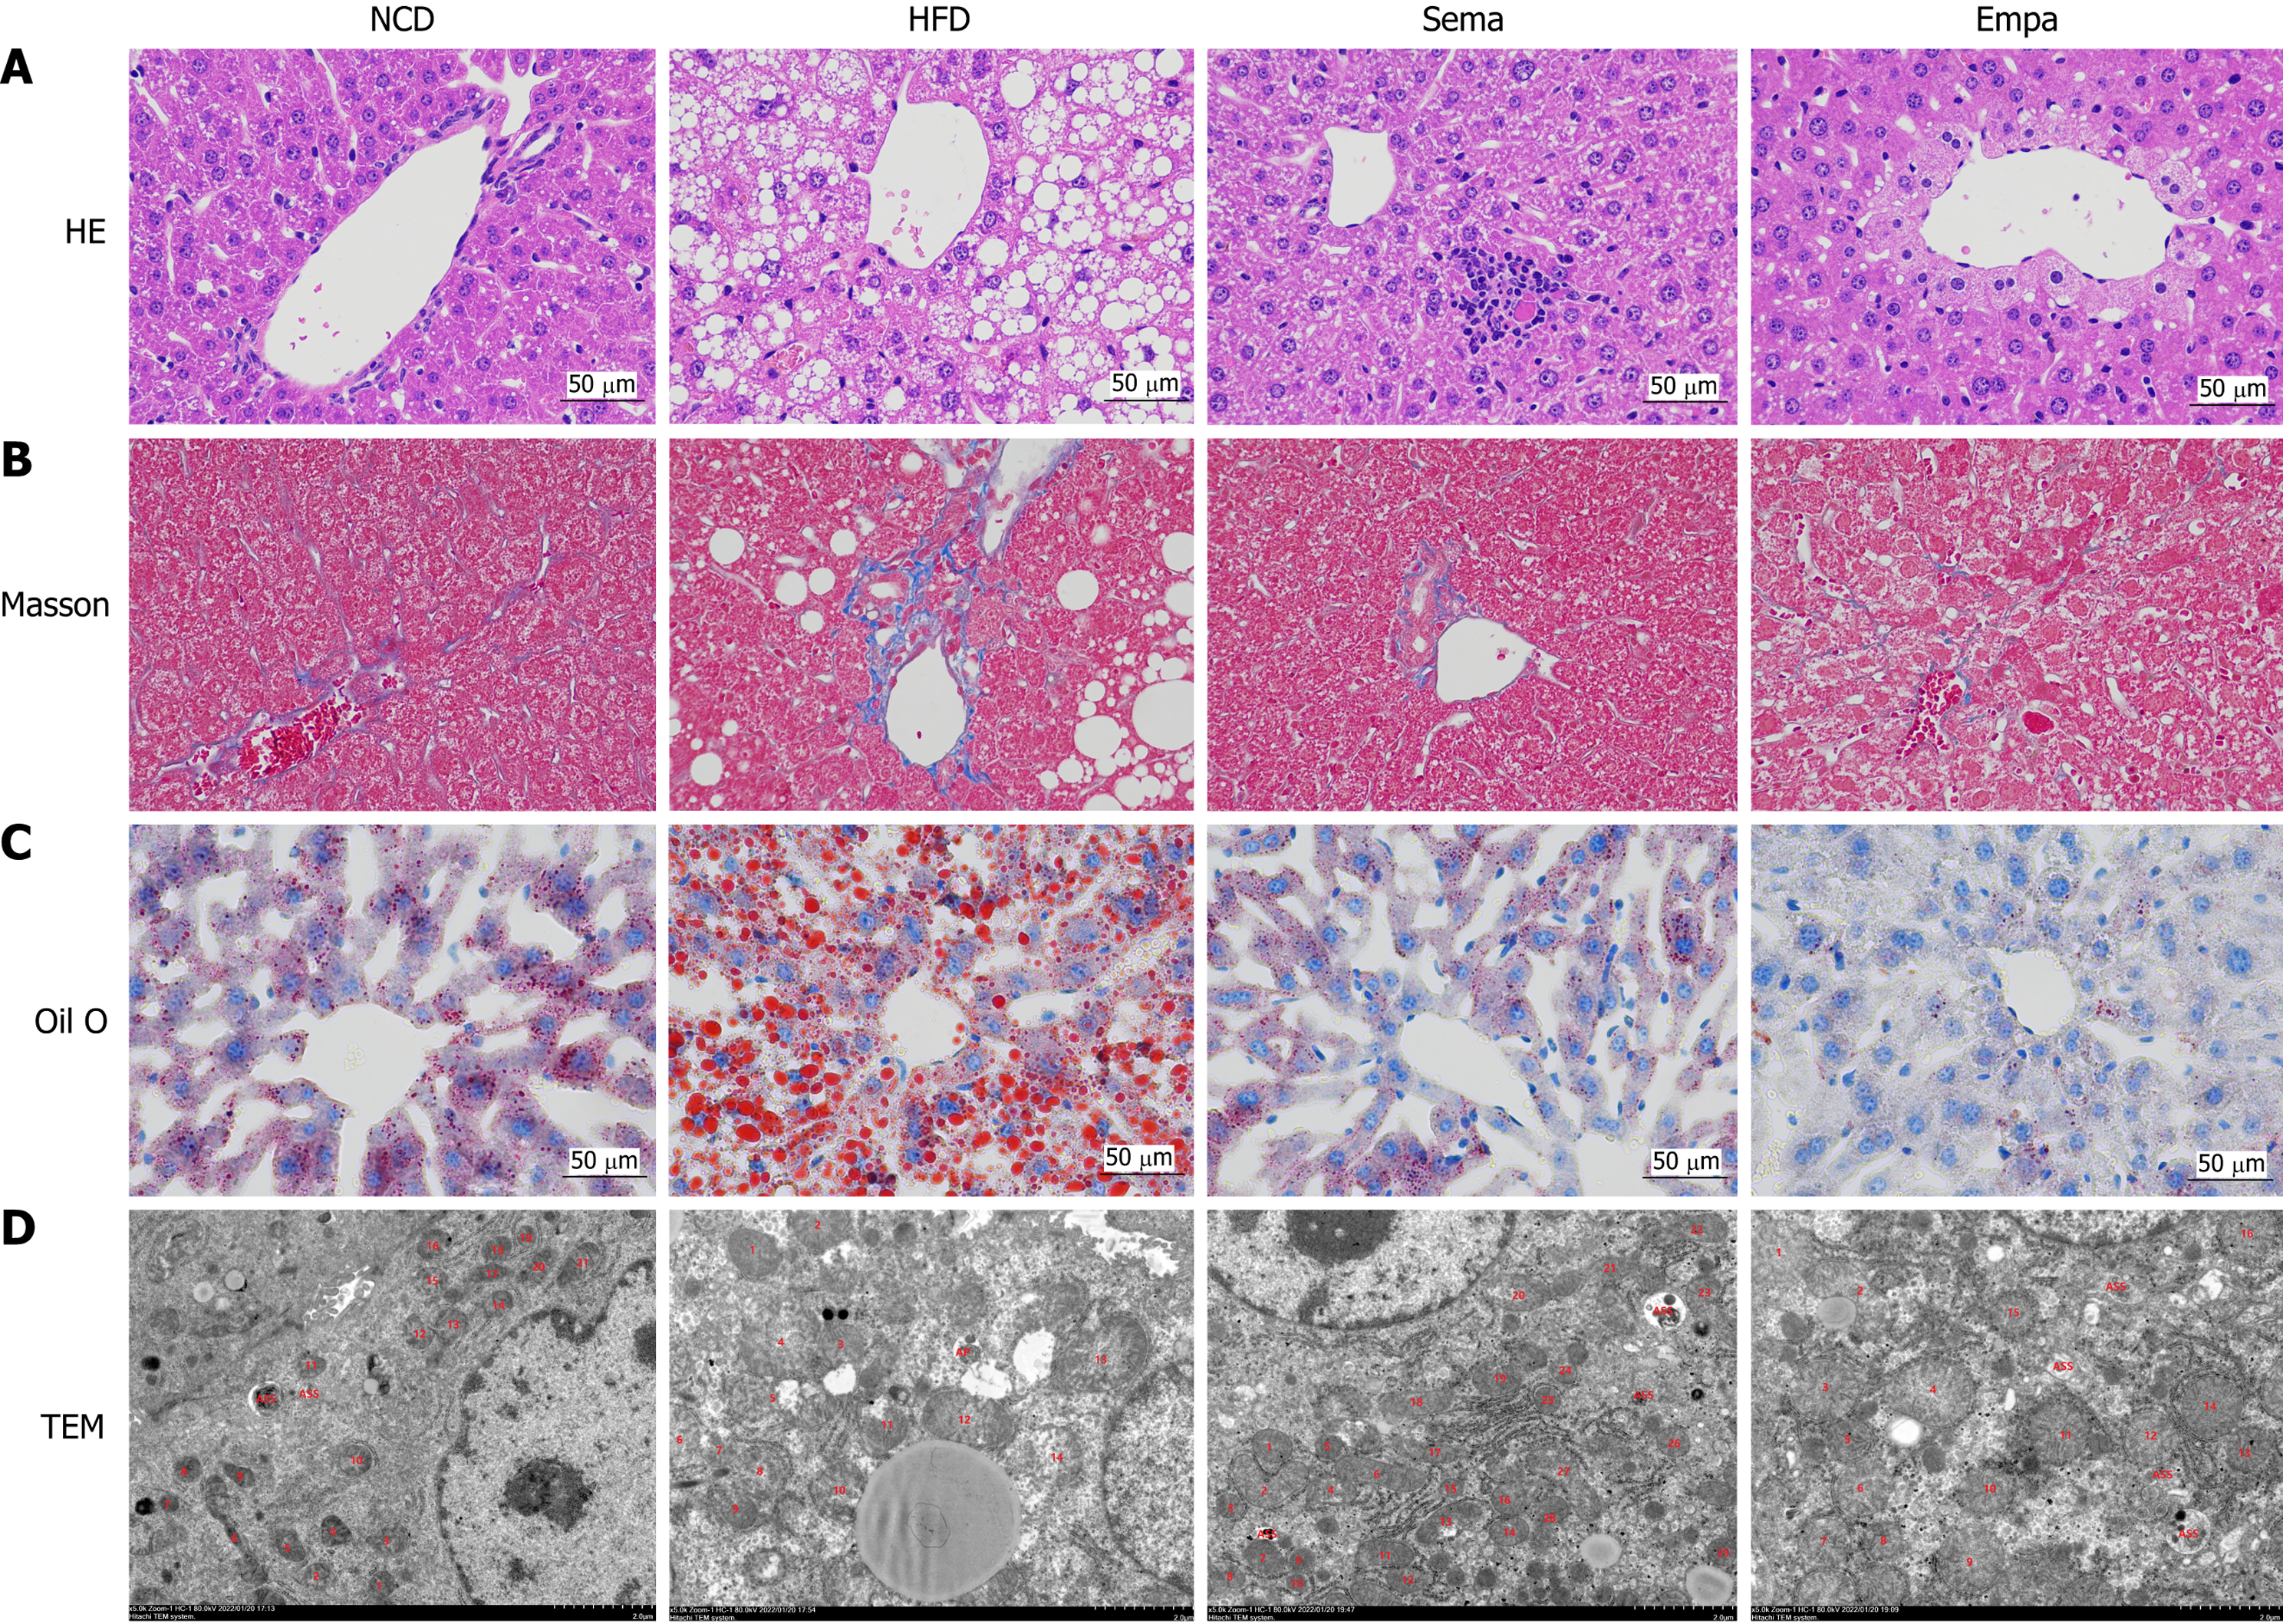
Figure 3 Changes in pathological structures.
A: Hematoxylin-eosin staining (400 ×); B: Masson staining (400 ×); C: Oil red staining (400 ×); D: Transmission electron microscopy images showed the mitochondria, mitochondrial microautophagy structure and ribosomes. HE: Hematoxylin-eosin; HFD: A high-fat group; NCD: A control group; TEM: Transmission electron microscopy.
- Citation: Niu S, Chen SC, Wang CX, Yue L, Wang SQ. Metabolic and hepatic effects of semaglutide and empagliflozin on metabolic dysfunction-associated steatotic liver disease mice. World J Hepatol 2025; 17(10): 110402
- URL: https://www.wjgnet.com/1948-5182/full/v17/i10/110402.htm
- DOI: https://dx.doi.org/10.4254/wjh.v17.i10.110402