
















©The Author(s) 2025.
World J Hepatol. Oct 27, 2025; 17(10): 110402
Published online Oct 27, 2025. doi: 10.4254/wjh.v17.i10.110402
Published online Oct 27, 2025. doi: 10.4254/wjh.v17.i10.110402
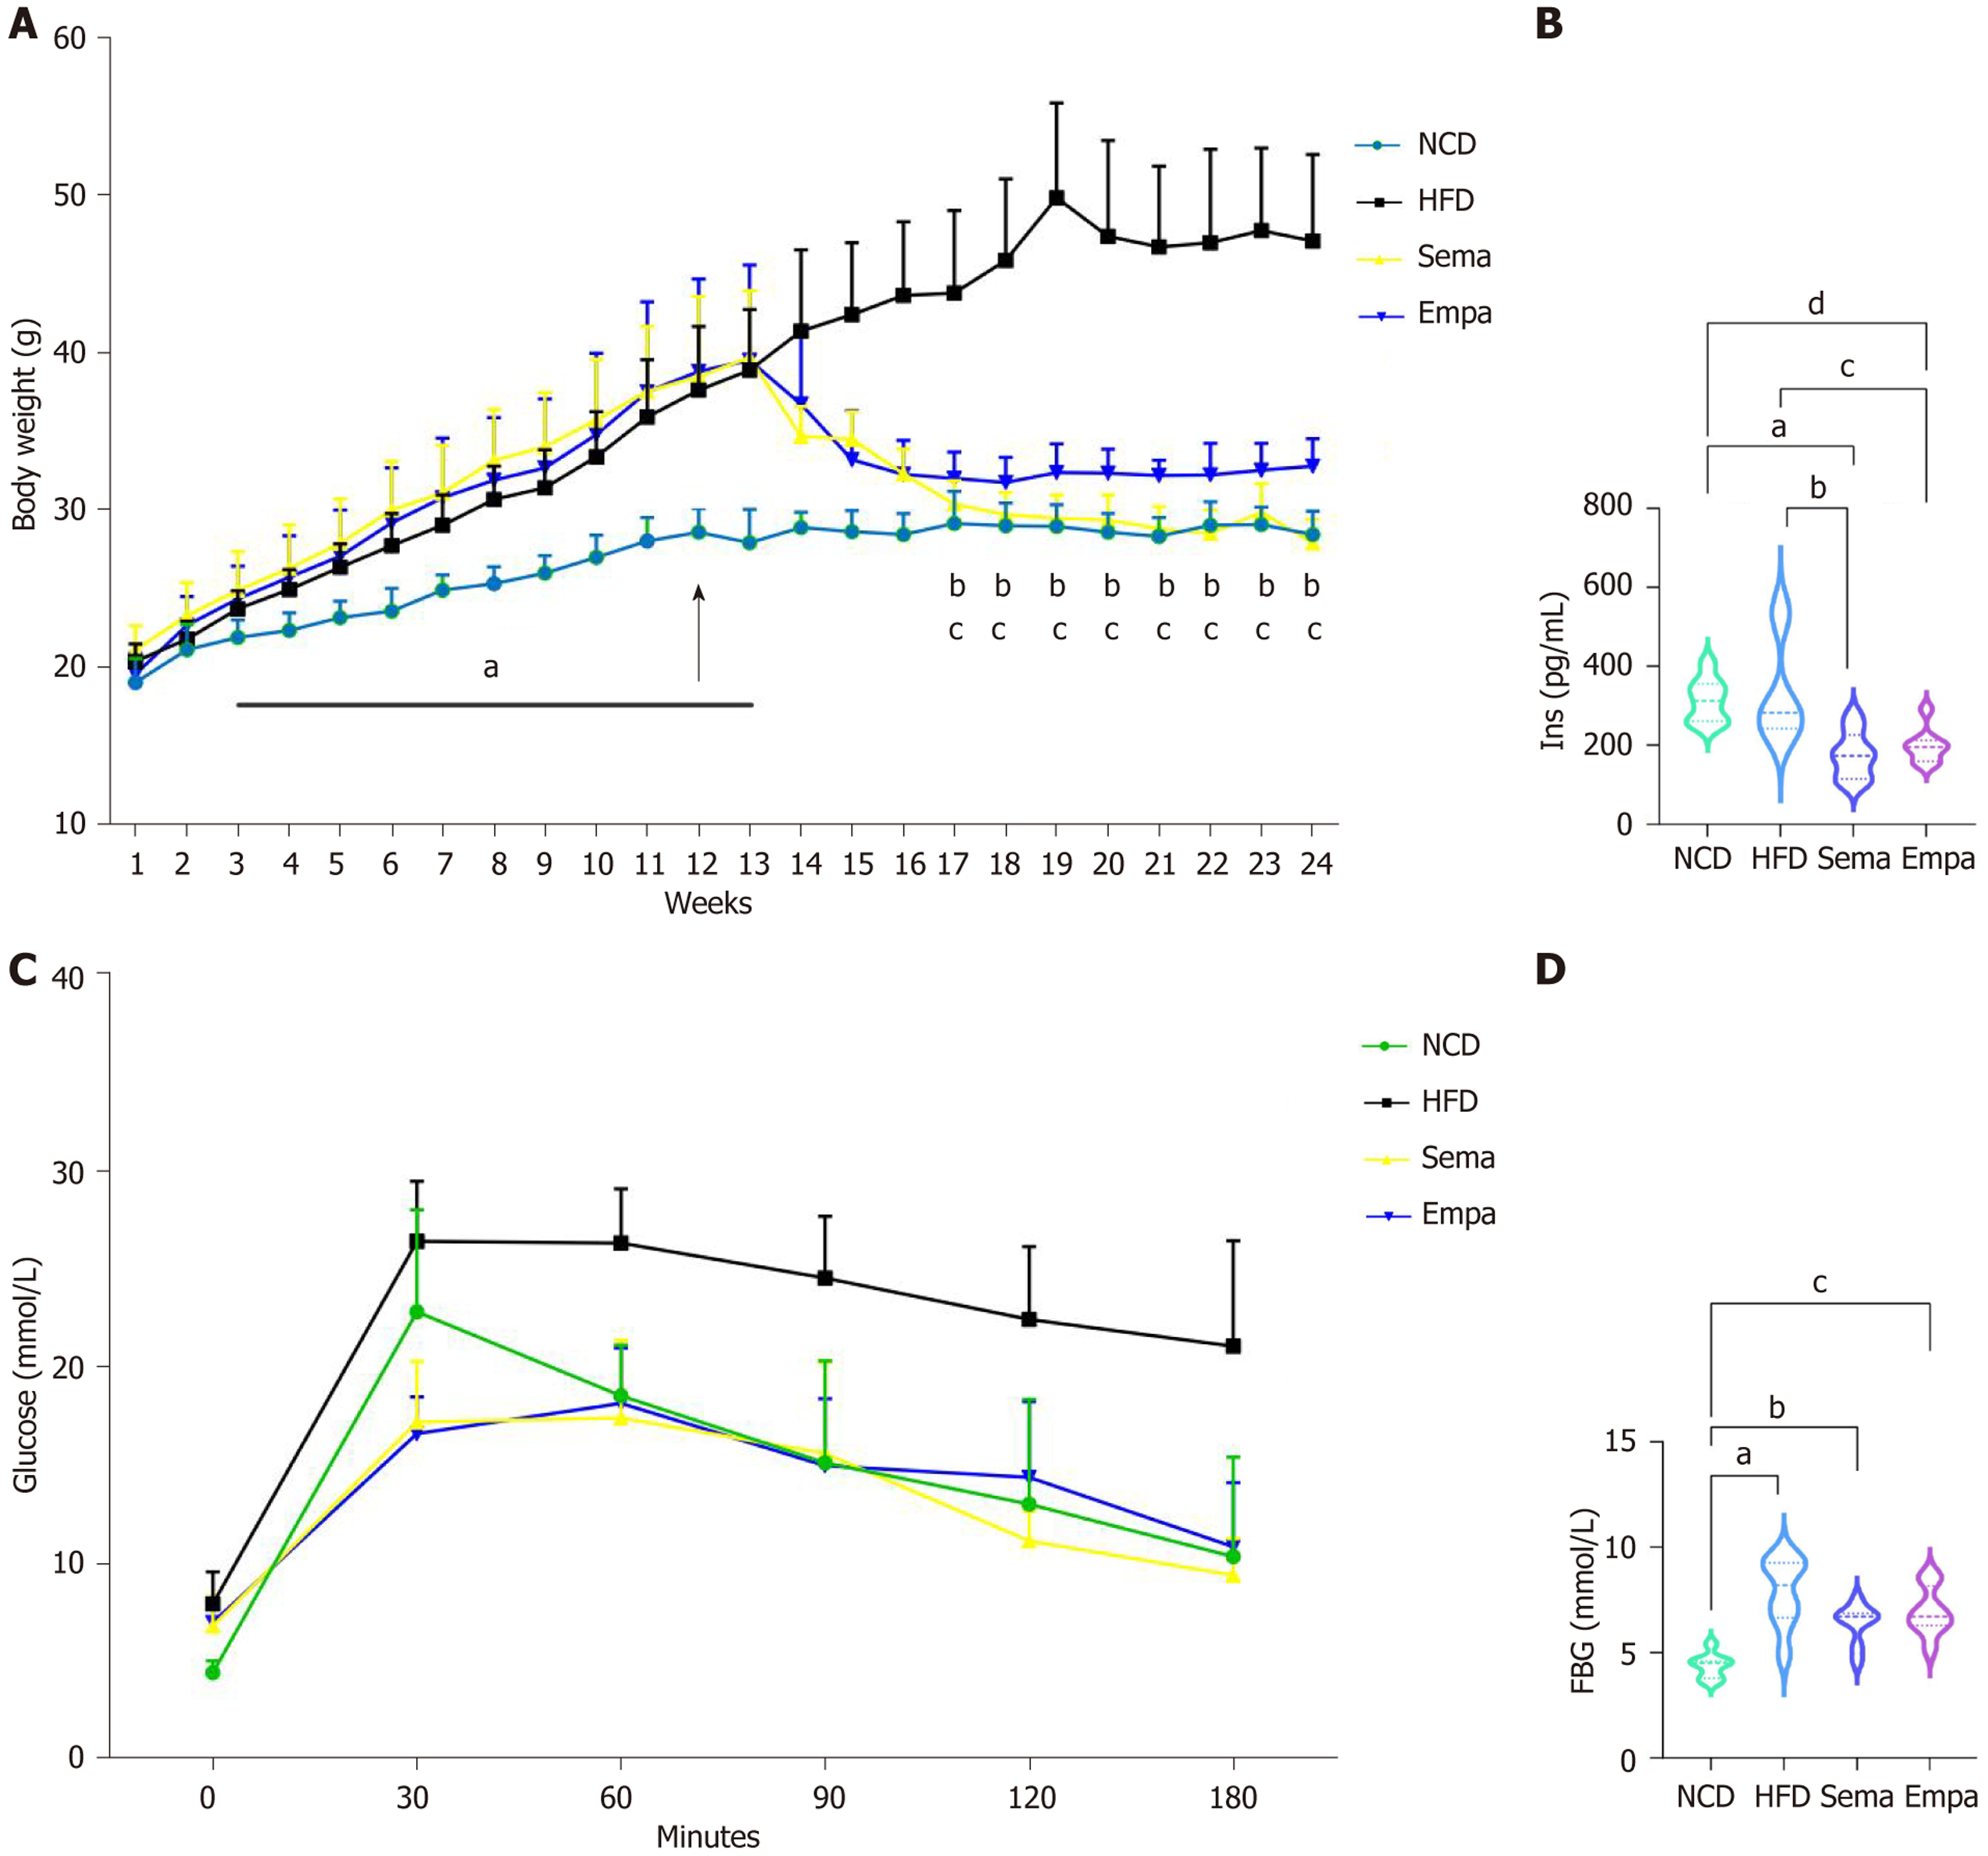
Figure 1 Changes in body weight and glucose metabolism.
A: Folding line graph of body weight change over time for each group of mice (n = 8). The black arrow indicates the point in time when semaglutide and empagliflozin intervened. The aP < 0.01 on the first straight line indicates high-fat group (HFD group) vs control group (NCD group); bP < 0.01 indicates HFD vs Sema; cP < 0.01 indicates HFD vs Empa; B: Comparison of insulin levels in four groups of mice (n = 8). aP < 0.01 indicates NCD vs Sema, bP < 0.01 indicates HFD vs Sema, cP < 0.01 indicates HFD vs Empa, dP < 0.01 indicates NCD vs Empa; C: Intraperitoneal glucose tolerance results. aP < 0.01 indicates HFD vs NCD, Sema and Empa; D: Comparison of fasting blood glucose levels in the four groups of mice (n = 8). aP < 0.01 indicates NCD vs HFD, bP < 0.01 indicates NCD vs Sema, cP < 0.01 indicates NCD vs Empa. FBG: Fasting blood glucose; HFD: A high-fat group; NCD: A control group.
- Citation: Niu S, Chen SC, Wang CX, Yue L, Wang SQ. Metabolic and hepatic effects of semaglutide and empagliflozin on metabolic dysfunction-associated steatotic liver disease mice. World J Hepatol 2025; 17(10): 110402
- URL: https://www.wjgnet.com/1948-5182/full/v17/i10/110402.htm
- DOI: https://dx.doi.org/10.4254/wjh.v17.i10.110402