
















©The Author(s) 2025.
World J Hepatol. Oct 27, 2025; 17(10): 109517
Published online Oct 27, 2025. doi: 10.4254/wjh.v17.i10.109517
Published online Oct 27, 2025. doi: 10.4254/wjh.v17.i10.109517
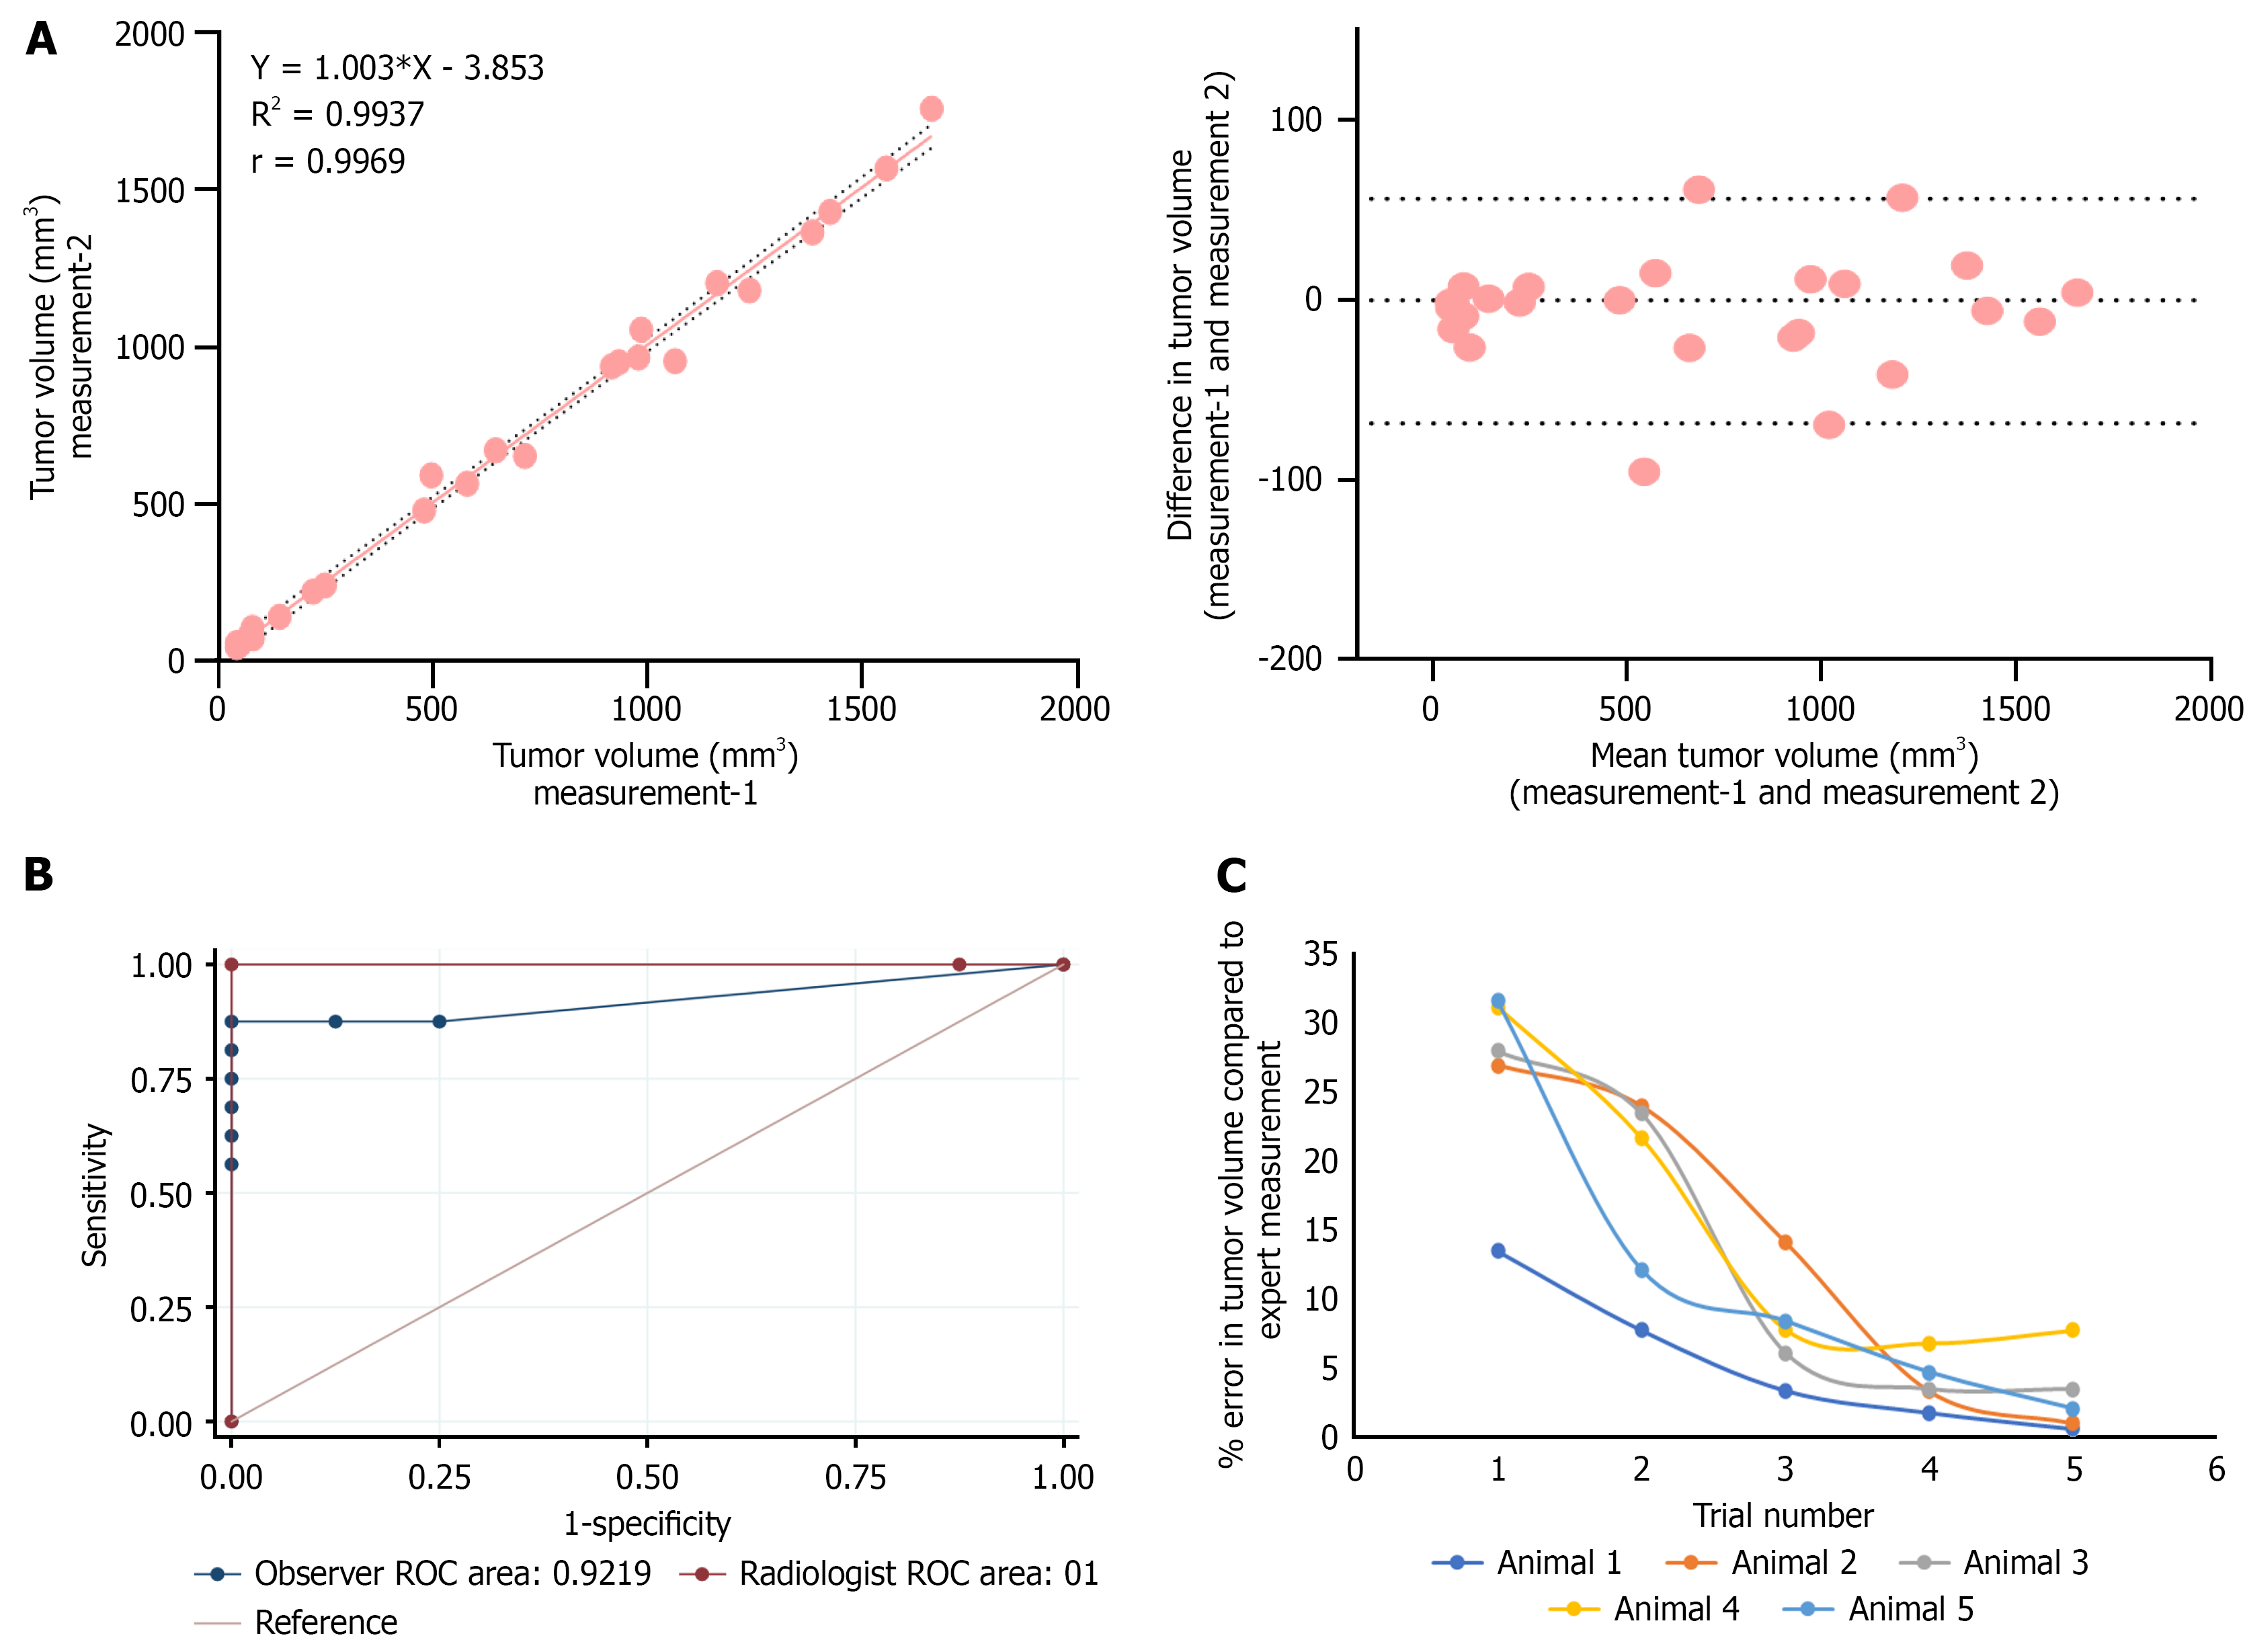
Figure 5 Evaluation of comparative receiver operating characteristics and intra-operator variability of tumor volume measurement by ultrasound imaging.
A: Linear correlation and Bland–Altman plot showing the agreement between two independent tumor volume measurements performed by a single observer(n = 25); B: Receiver operating characteristics curves evaluating the diagnostic accuracy of ultrasound-guided tumor volume measurement performed by an expert radiologist and a non-expert(n = 25). Sensitivity and specificity were calculated using visual inspection and histopathological confirmation as the gold standard. The area under the curve (AUC) for expert measurements was 1, indicating excellent discriminatory ability, while AUC of observer was slight reduced as 0.92 as the non-expert observer misclassified two tumor and two non-tumor samples, resulting in a sensitivity of 87.5% and specificity of 75%; C: Learning curve of a non-expert trainee for ultrasound-based tumor volume measurement (n = 5). The cumulative percentage error decreased from 148% to 16% by the fifth day of training. ROC: Receiver operating characteristics.
- Citation: Devan AR, Sasidharan SM, Sreekumar KP, Unni AKK, Mangalathillam S, Ansar A, Unni AR, Nath LR. Ultrasound imaging-guided protocol for monitoring tumor growth in orthotopic rat model of hepatocellular carcinoma. World J Hepatol 2025; 17(10): 109517
- URL: https://www.wjgnet.com/1948-5182/full/v17/i10/109517.htm
- DOI: https://dx.doi.org/10.4254/wjh.v17.i10.109517