
















©The Author(s) 2025.
World J Hepatol. Oct 27, 2025; 17(10): 109517
Published online Oct 27, 2025. doi: 10.4254/wjh.v17.i10.109517
Published online Oct 27, 2025. doi: 10.4254/wjh.v17.i10.109517
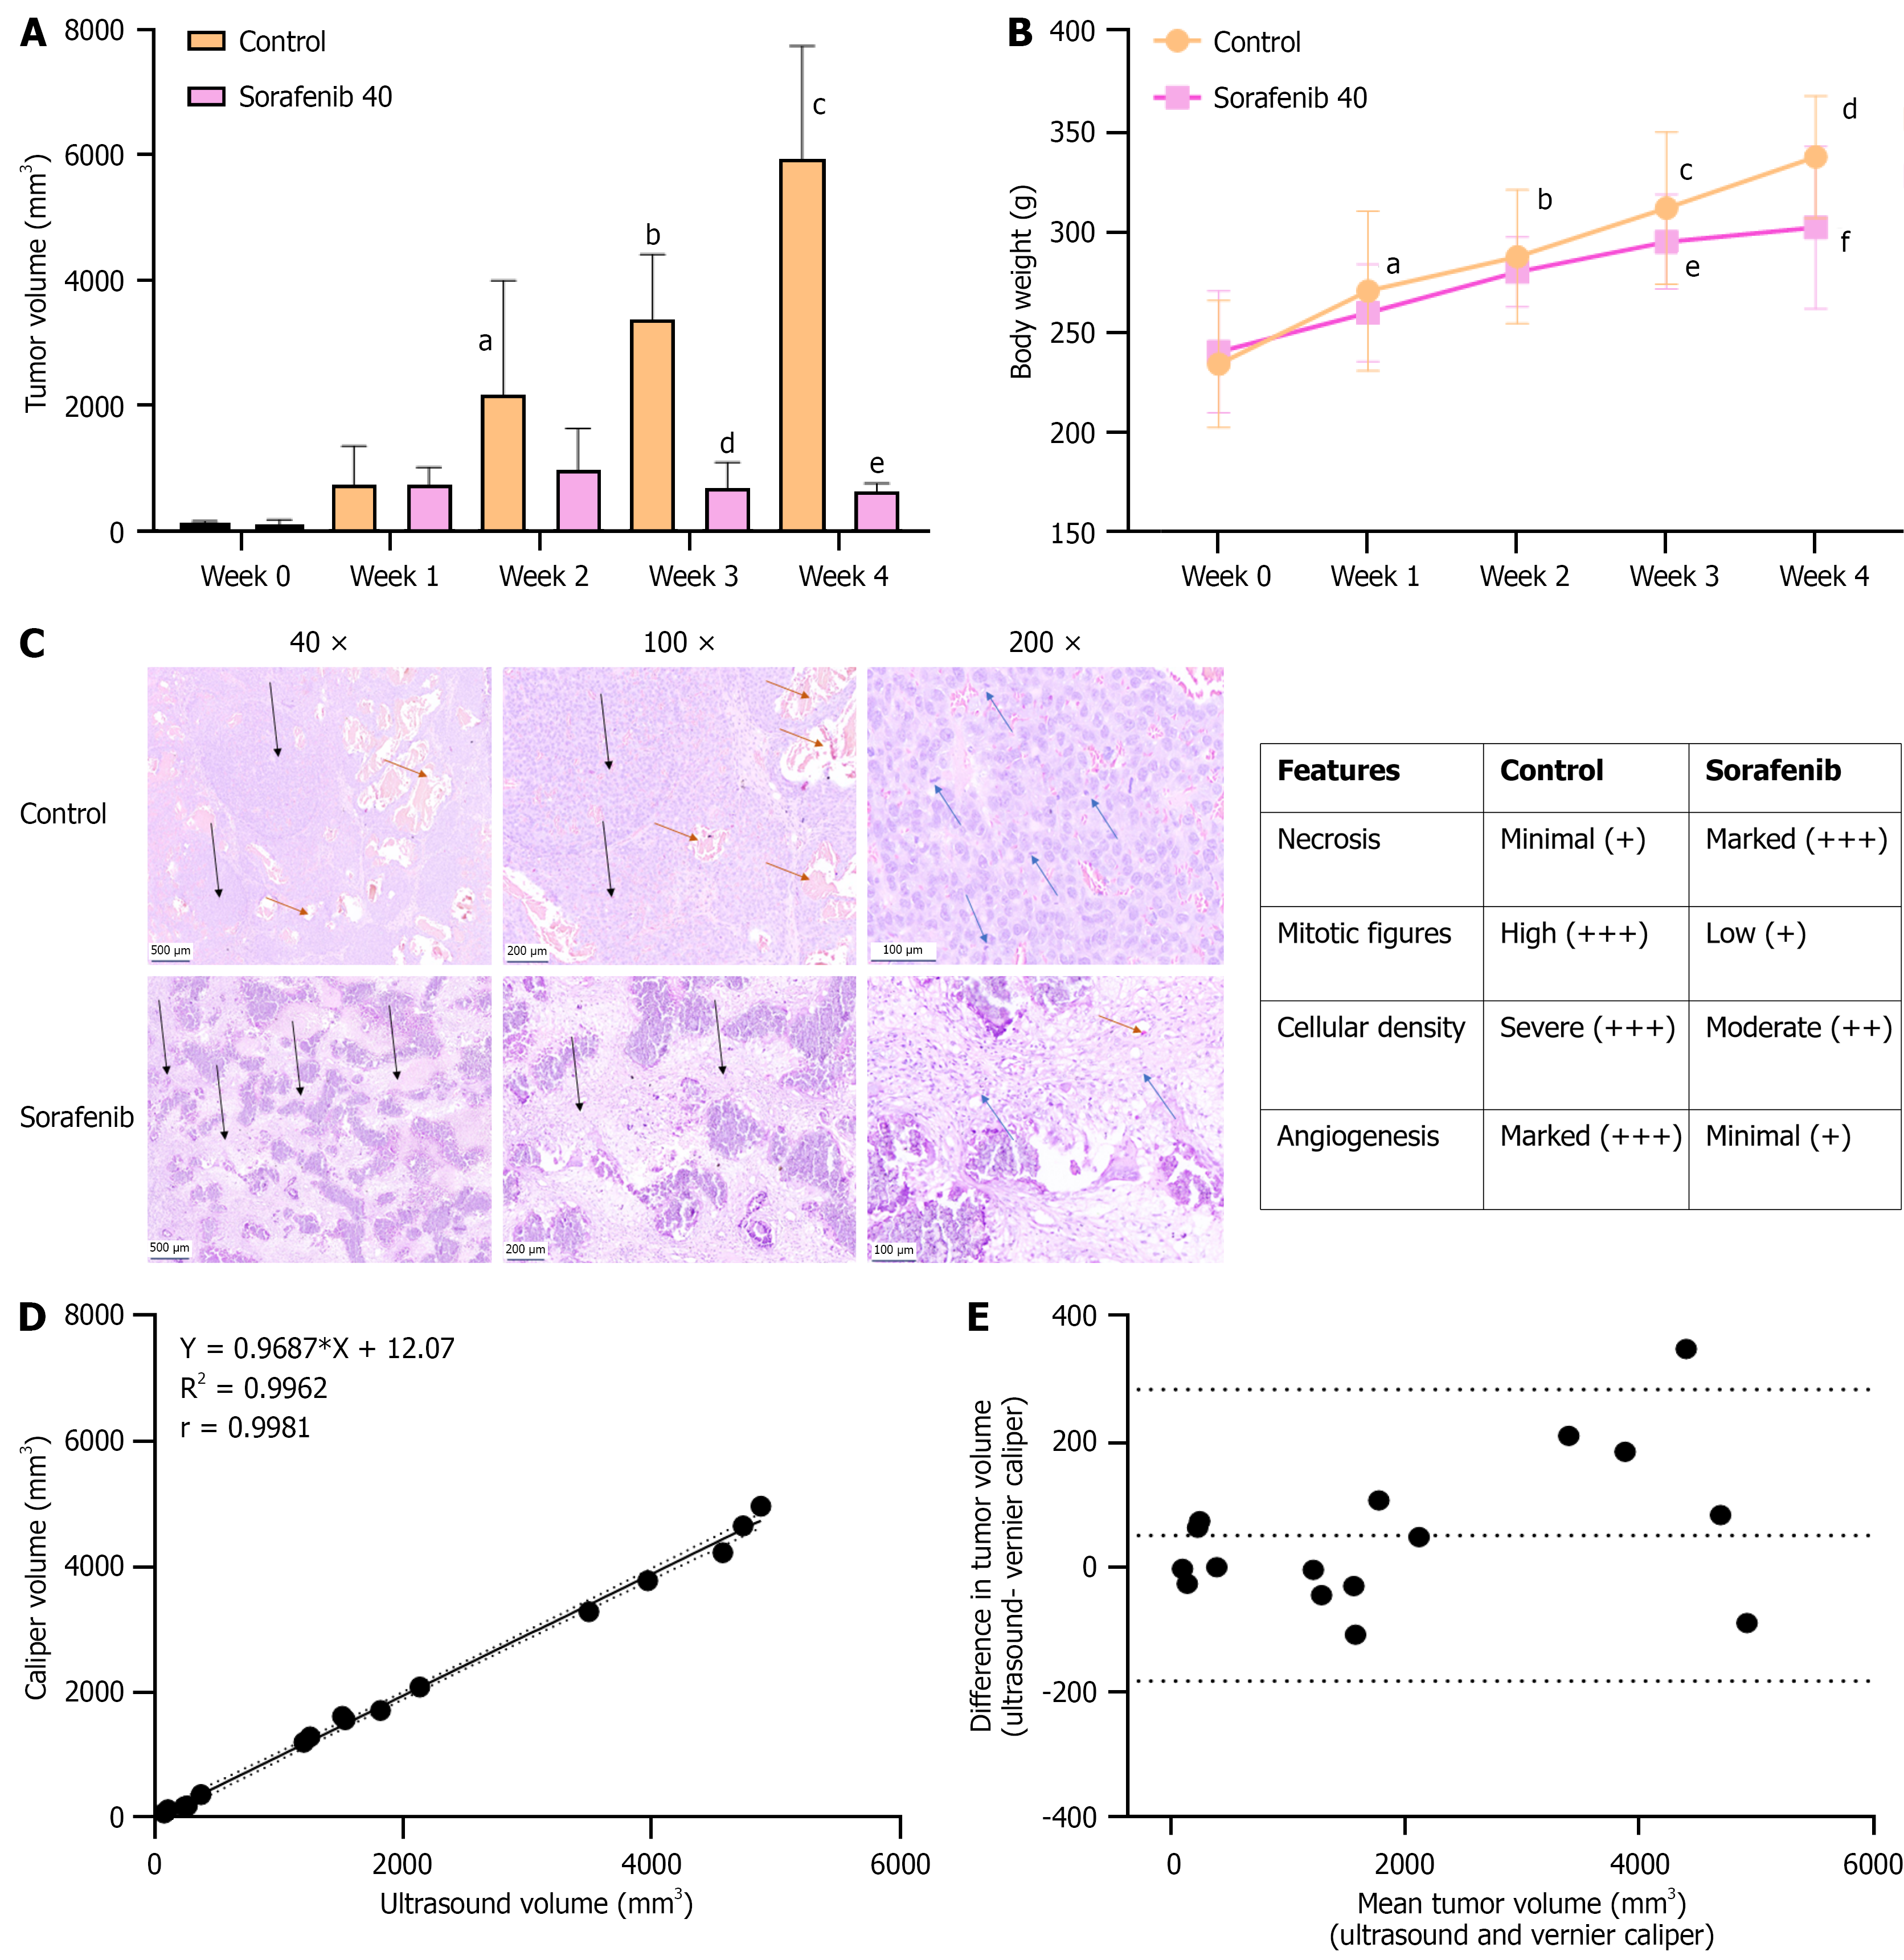
Figure 3 Correlation of ultrasound-guided tumor growth with gross tumor measurements and histopathologic features.
A: Mean tumor volume of N1S1 hepatocellular carcinoma tumors in control and Sorafenib-treated groups. Sorafenib was administered at 40 mg/kg, three times weekly for four weeks, resulting in significant tumor growth inhibition. Data represent mean ± SD (n = 14 per group). aP < 0.01 control, week 0 vs control, week 2); bP < 0.001 (control, week 0 vs control, week 3); cP < 0.001 (Control, week 0 vs control, week 4); dP < 0.001 (control, week 3 vs Sorafenib, week 3); eP < 0.001 (control, week 4 vs Sorafenib, week 4); B: Changes in body weight during the treatment period. Data represent mean ± SD (n = 14 per group). aP < 0.05 (control, week 0 vs week 1); bP < 0.001 (control, week 0 vs week 2); cP < 0.001 (control, week 0 vs week 3); dP < 0.001 (control, week 0 vs week 4); eP < 0.001 (Sorafenib, week 0 vs week 3); fP < 0.001 (Sorafenib, week 0 vs week 4); C: Histopathological evaluation of tumor tissues from control and Sorafenib-treated animals. Formalin-fixed sections were stained with hematoxylin and eosin. Images include control and Sorafenib treated tumor tissue at 40 ×, 100 × and 200 × magnification (size bar for: 500 μm = 40 ×, 200 μm = 100 ×, 100 μm = 200 ×). Control tumors showed proliferating neoplastic cells with complete liver parenchymal invasion, multifocal large neoplastic foci (black arrows), high cellularity, and numerous mitotic figures (blue arrows). Marked angiogenesis was observed (brown arrows). Sorafenib-treated tumors displayed reduced cellularity, fewer mitotic figures (blue arrows), prominent necrosis (black arrows), and mild angiogenesis (brown arrows); D: Correlation between tumor volume measurements by ultrasound (US) and vernier caliper (VC) methods. A linear correlation plot is shown with 95% confidence bands (dotted lines); Pearson correlation coefficient r = 0.9981, P < 0.001 (n = 16); E: Agreement between US and VC measurements is shown by a Bland-Altman plot. The central dotted line represents the mean bias (50.97), and the upper and lower dotted lines represent the limits of agreement (50.97 ± 1.96 × 118.9).
- Citation: Devan AR, Sasidharan SM, Sreekumar KP, Unni AKK, Mangalathillam S, Ansar A, Unni AR, Nath LR. Ultrasound imaging-guided protocol for monitoring tumor growth in orthotopic rat model of hepatocellular carcinoma. World J Hepatol 2025; 17(10): 109517
- URL: https://www.wjgnet.com/1948-5182/full/v17/i10/109517.htm
- DOI: https://dx.doi.org/10.4254/wjh.v17.i10.109517