
















©The Author(s) 2025.
World J Hepatol. Oct 27, 2025; 17(10): 109517
Published online Oct 27, 2025. doi: 10.4254/wjh.v17.i10.109517
Published online Oct 27, 2025. doi: 10.4254/wjh.v17.i10.109517
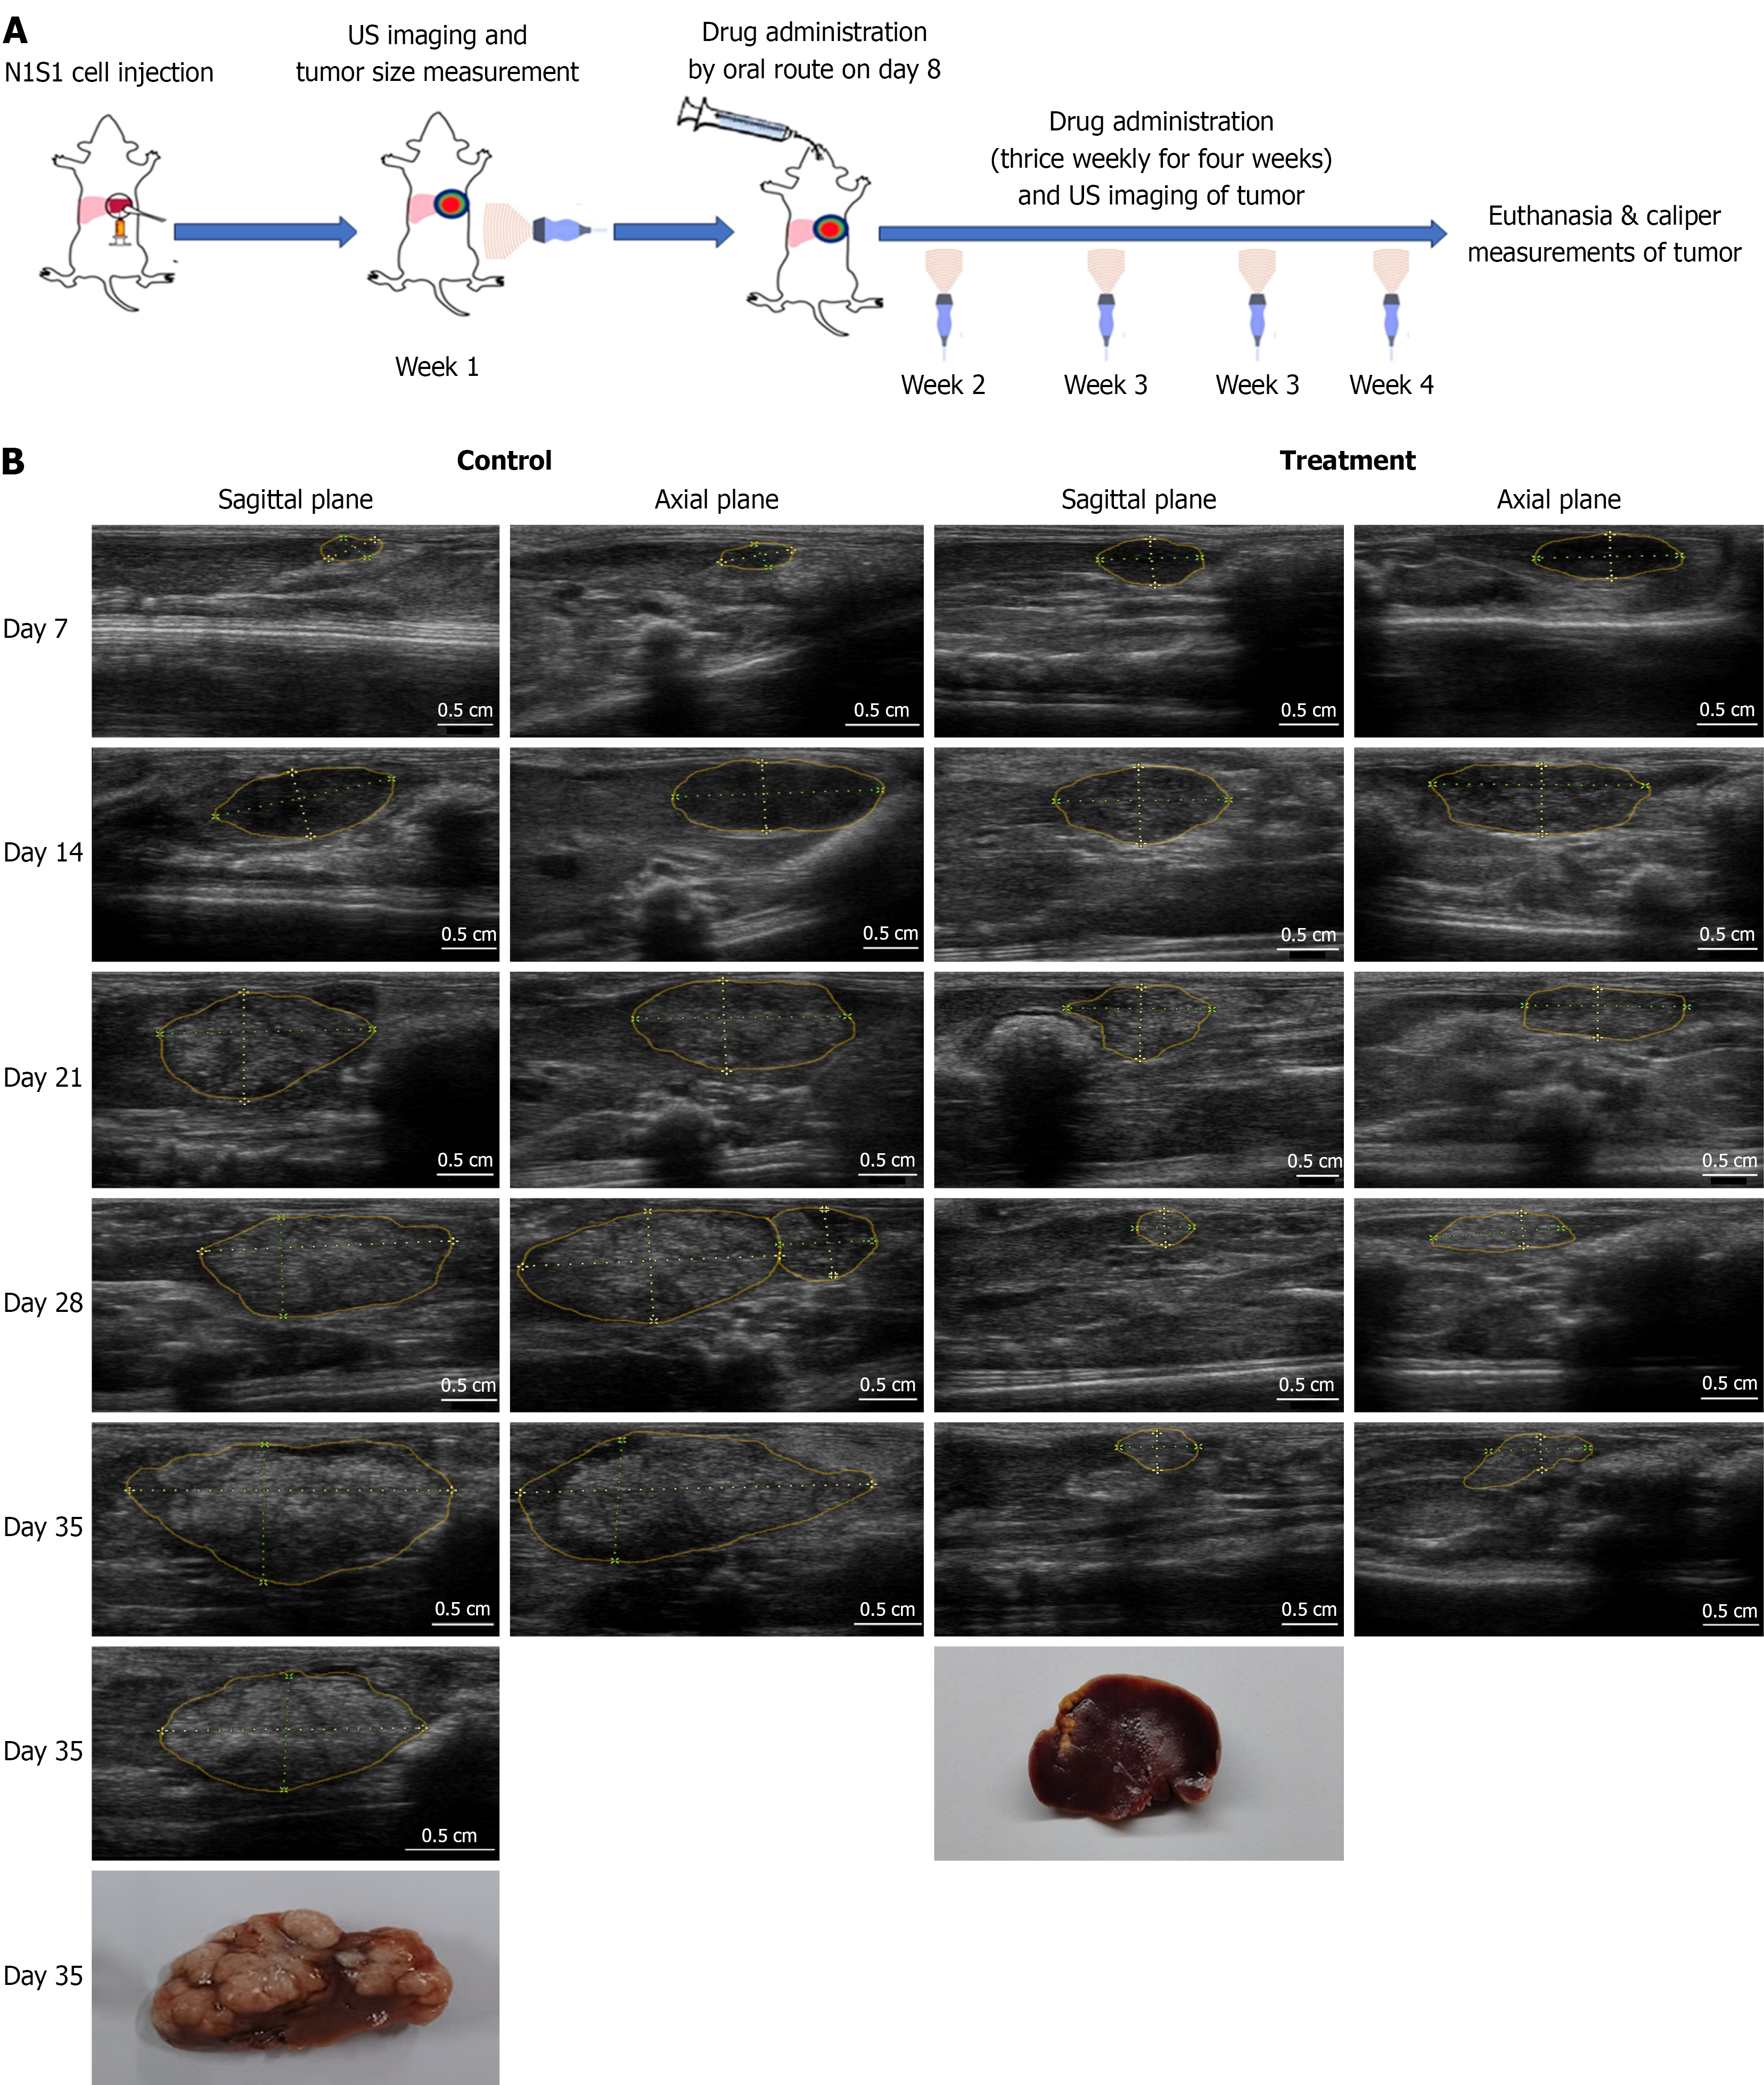
Figure 2 Evaluation of treatment efficacy on N1S1 tumor growth using ultrasound imaging.
A: Schematic representation of the experimental design of animal study; B: Representative ultrasound (US) images of orthotopic liver tumors from untreated and Sorafenib-treated (40 mg/kg) groups on Days 7, 14, 21, 28, and 35 post-cell implantation. Sagittal and axial plane images were acquired for tumor volume calculations. By injecting cells at the liver tip and imaging in both planes, a clear view of the tumor was achieved, minimizing interference from adjacent lobes and surrounding organs. Tumor regions are delineated with solid yellow lines, and linear measurements are indicated by yellow dotted lines. For tumor volume estimation, the longest dimension observed across both planes was recorded as the "long diameter," while the shortest dimension was considered the "short diameter". Tumor volume calculated using the ellipsoid formula: V = (l × s²)/2, where l is the long axis and s is the short axis, measured in mm. Post-necropsy, these dimensions were also measured using a vernier caliper and compared with US-based tumor volume assessments.
- Citation: Devan AR, Sasidharan SM, Sreekumar KP, Unni AKK, Mangalathillam S, Ansar A, Unni AR, Nath LR. Ultrasound imaging-guided protocol for monitoring tumor growth in orthotopic rat model of hepatocellular carcinoma. World J Hepatol 2025; 17(10): 109517
- URL: https://www.wjgnet.com/1948-5182/full/v17/i10/109517.htm
- DOI: https://dx.doi.org/10.4254/wjh.v17.i10.109517