Copyright
©The Author(s) 2024.
World J Hepatol. Jan 27, 2024; 16(1): 65-74
Published online Jan 27, 2024. doi: 10.4254/wjh.v16.i1.65
Published online Jan 27, 2024. doi: 10.4254/wjh.v16.i1.65
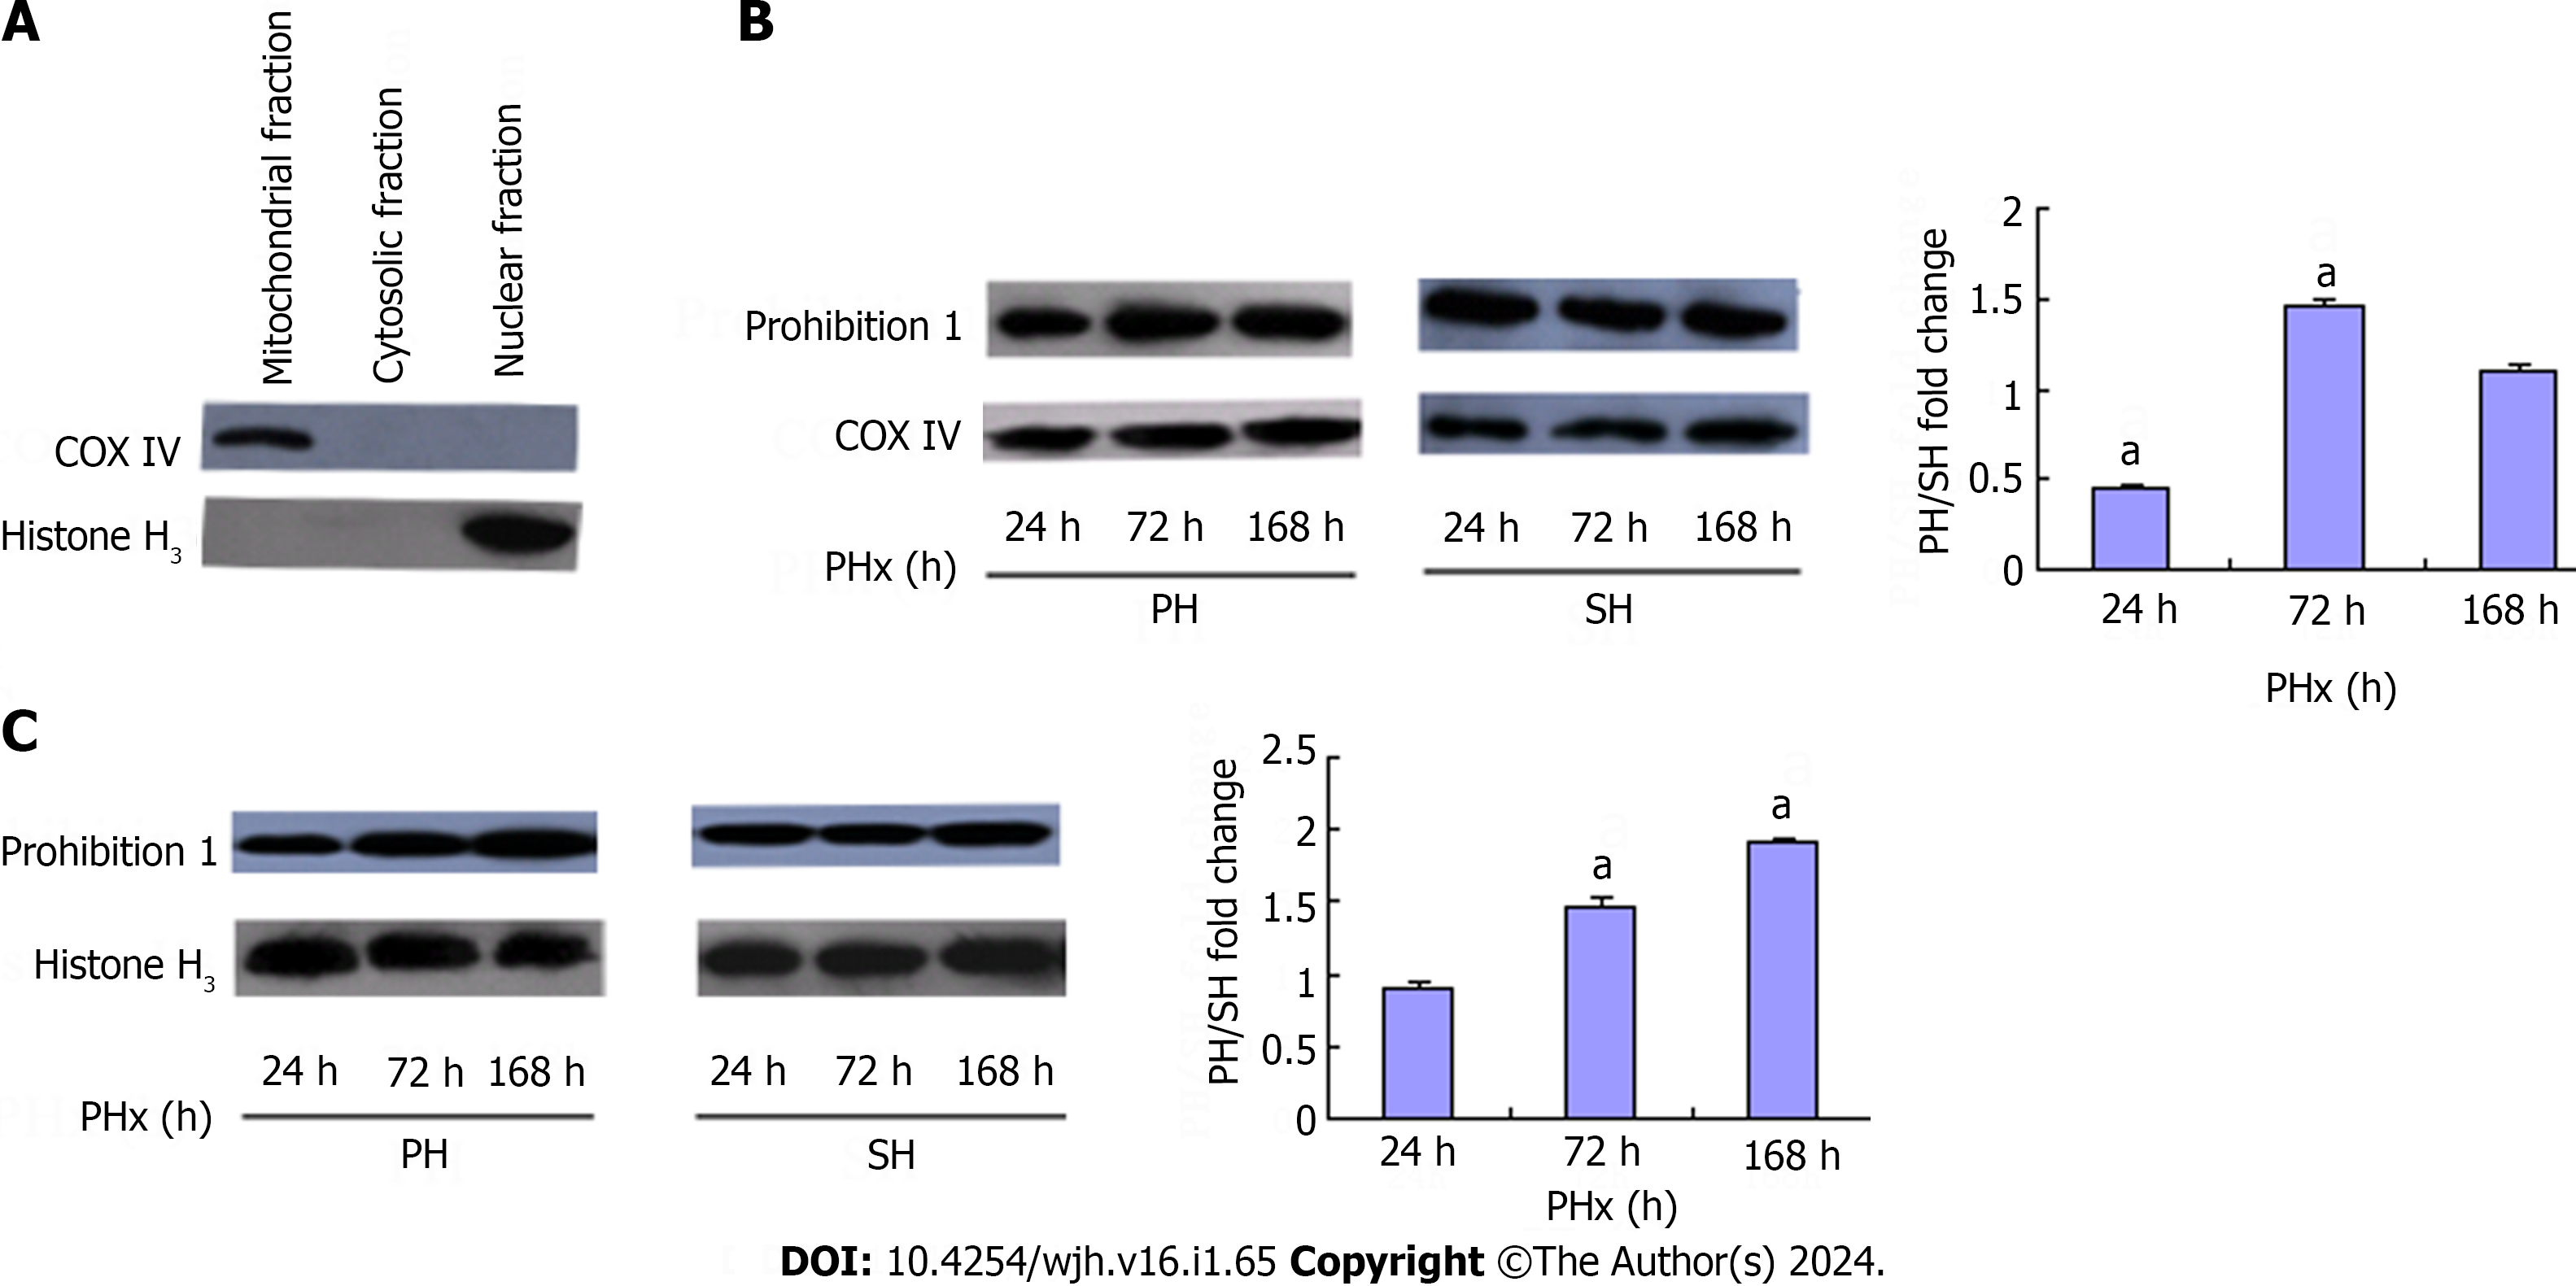
Figure 2 Subcellular distribution and protein abundance alterations of prohibitin 1 during liver regeneration.
Equal amounts of protein extracts obtained from each subcellular fraction were separated on 12% SDS-PAGE and immunoblotted with antibodies against prohibitin 1 (Phb1), cyclooxygenase IV (COX IV) and histone H3. A: Control western blotting for subcellular fractionation (COX IV for mitochondria and Histone H3 for nuclei). The grouping of gels/blots were cropped from different parts of different gels; B: Changes in Phb1 protein abundance in mitochondria. On the left are the western blotting results, and on the right is a gray analysis of the results showing the fold changes of Phb1 expression in mitochondria in PH groups in comparison with SH groups, standardized by the amounts of COX IV. The grouping of gels/blots in PH groups were cropped from different parts of the same gel. The grouping of gels/blots in SH groups were cropped from different parts of the same gel; C: Changes of Phb1 protein abundance in nucleus. On the left are the Western blotting results, and on the right is a gray analysis of the results showing the fold changes of Phb1 expression in nucleus in PH groups in comparison with SH groups, standardized by the amounts of Histone H3. The grouping of gels/blots for Phb1 were cropped from different parts of the same gel. The grouping of gels/blots for histone H3 were cropped from different parts of the same gel. PH: 70% PHx test groups; PHx: Partial hepatectomy; SH: Sham-operation control groups. Results are from three independent experiments and data are represented as means ± SD. aP < 0.05, versus control group, significant difference.
- Citation: Sun QJ, Liu T. Subcellular distribution of prohibitin 1 in rat liver during liver regeneration and its cellular implication. World J Hepatol 2024; 16(1): 65-74
- URL: https://www.wjgnet.com/1948-5182/full/v16/i1/65.htm
- DOI: https://dx.doi.org/10.4254/wjh.v16.i1.65


