Copyright
©The Author(s) 2023.
World J Hepatol. Nov 27, 2023; 15(11): 1237-1249
Published online Nov 27, 2023. doi: 10.4254/wjh.v15.i11.1237
Published online Nov 27, 2023. doi: 10.4254/wjh.v15.i11.1237
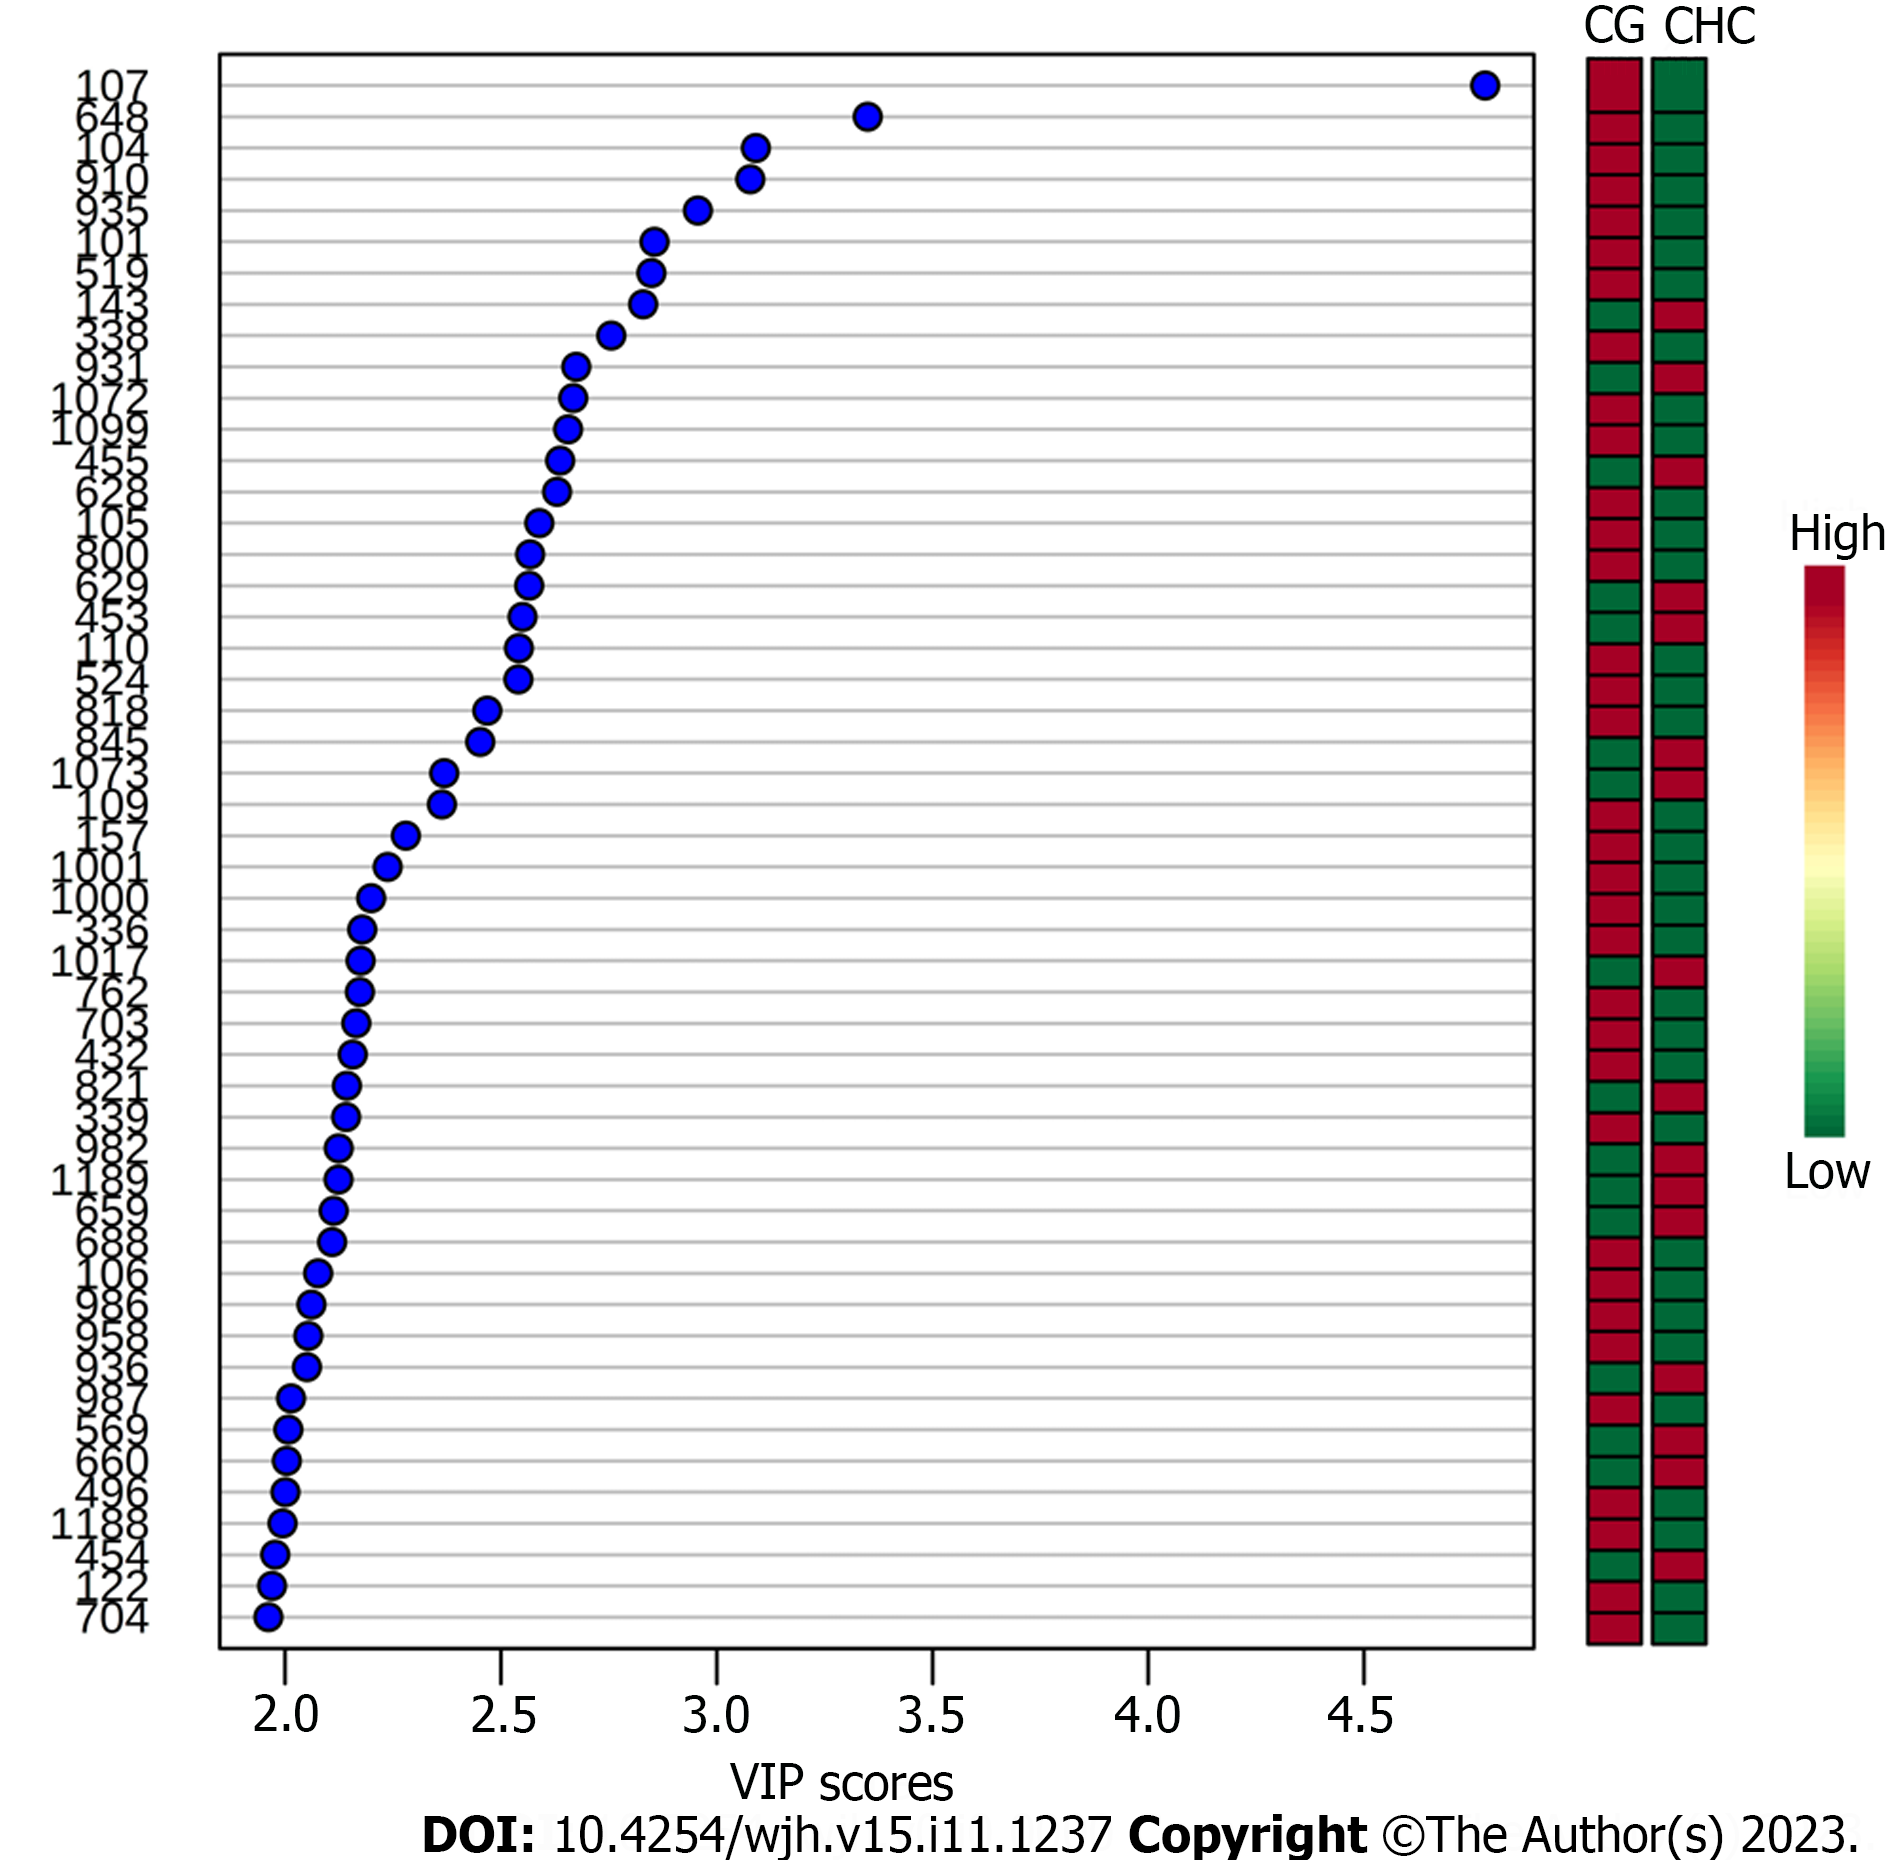
Figure 4 Variable importance score of the biomarkers identified when comparing the chronic hepatitis C vs healthy control groups.
The Y axis represents the metabolites m/z ratio. The X axis indicates the importance in projection for each biomarker. Laterally to the right, the relevance of each specific marker within the group analyzed is represented according to the color gradations of each biomarker for each grade of fibrosis. The red color represents the most relevant biomarkers; as the red intensity decreases and approaches the green color, the relevance of the biomarkers reduces. Red = up-regulation; Green = down-regulation. VIP Score: Variable importance score.
- Citation: Ferrasi AC, Lima SVG, Galvani AF, Delafiori J, Dias-Audibert FL, Catharino RR, Silva GF, Praxedes RR, Santos DB, Almeida DTM, Lima EO. Metabolomics in chronic hepatitis C: Decoding fibrosis grading and underlying pathways. World J Hepatol 2023; 15(11): 1237-1249
- URL: https://www.wjgnet.com/1948-5182/full/v15/i11/1237.htm
- DOI: https://dx.doi.org/10.4254/wjh.v15.i11.1237


