Copyright
©The Author(s) 2022.
World J Hepatol. Apr 27, 2022; 14(4): 754-765
Published online Apr 27, 2022. doi: 10.4254/wjh.v14.i4.754
Published online Apr 27, 2022. doi: 10.4254/wjh.v14.i4.754
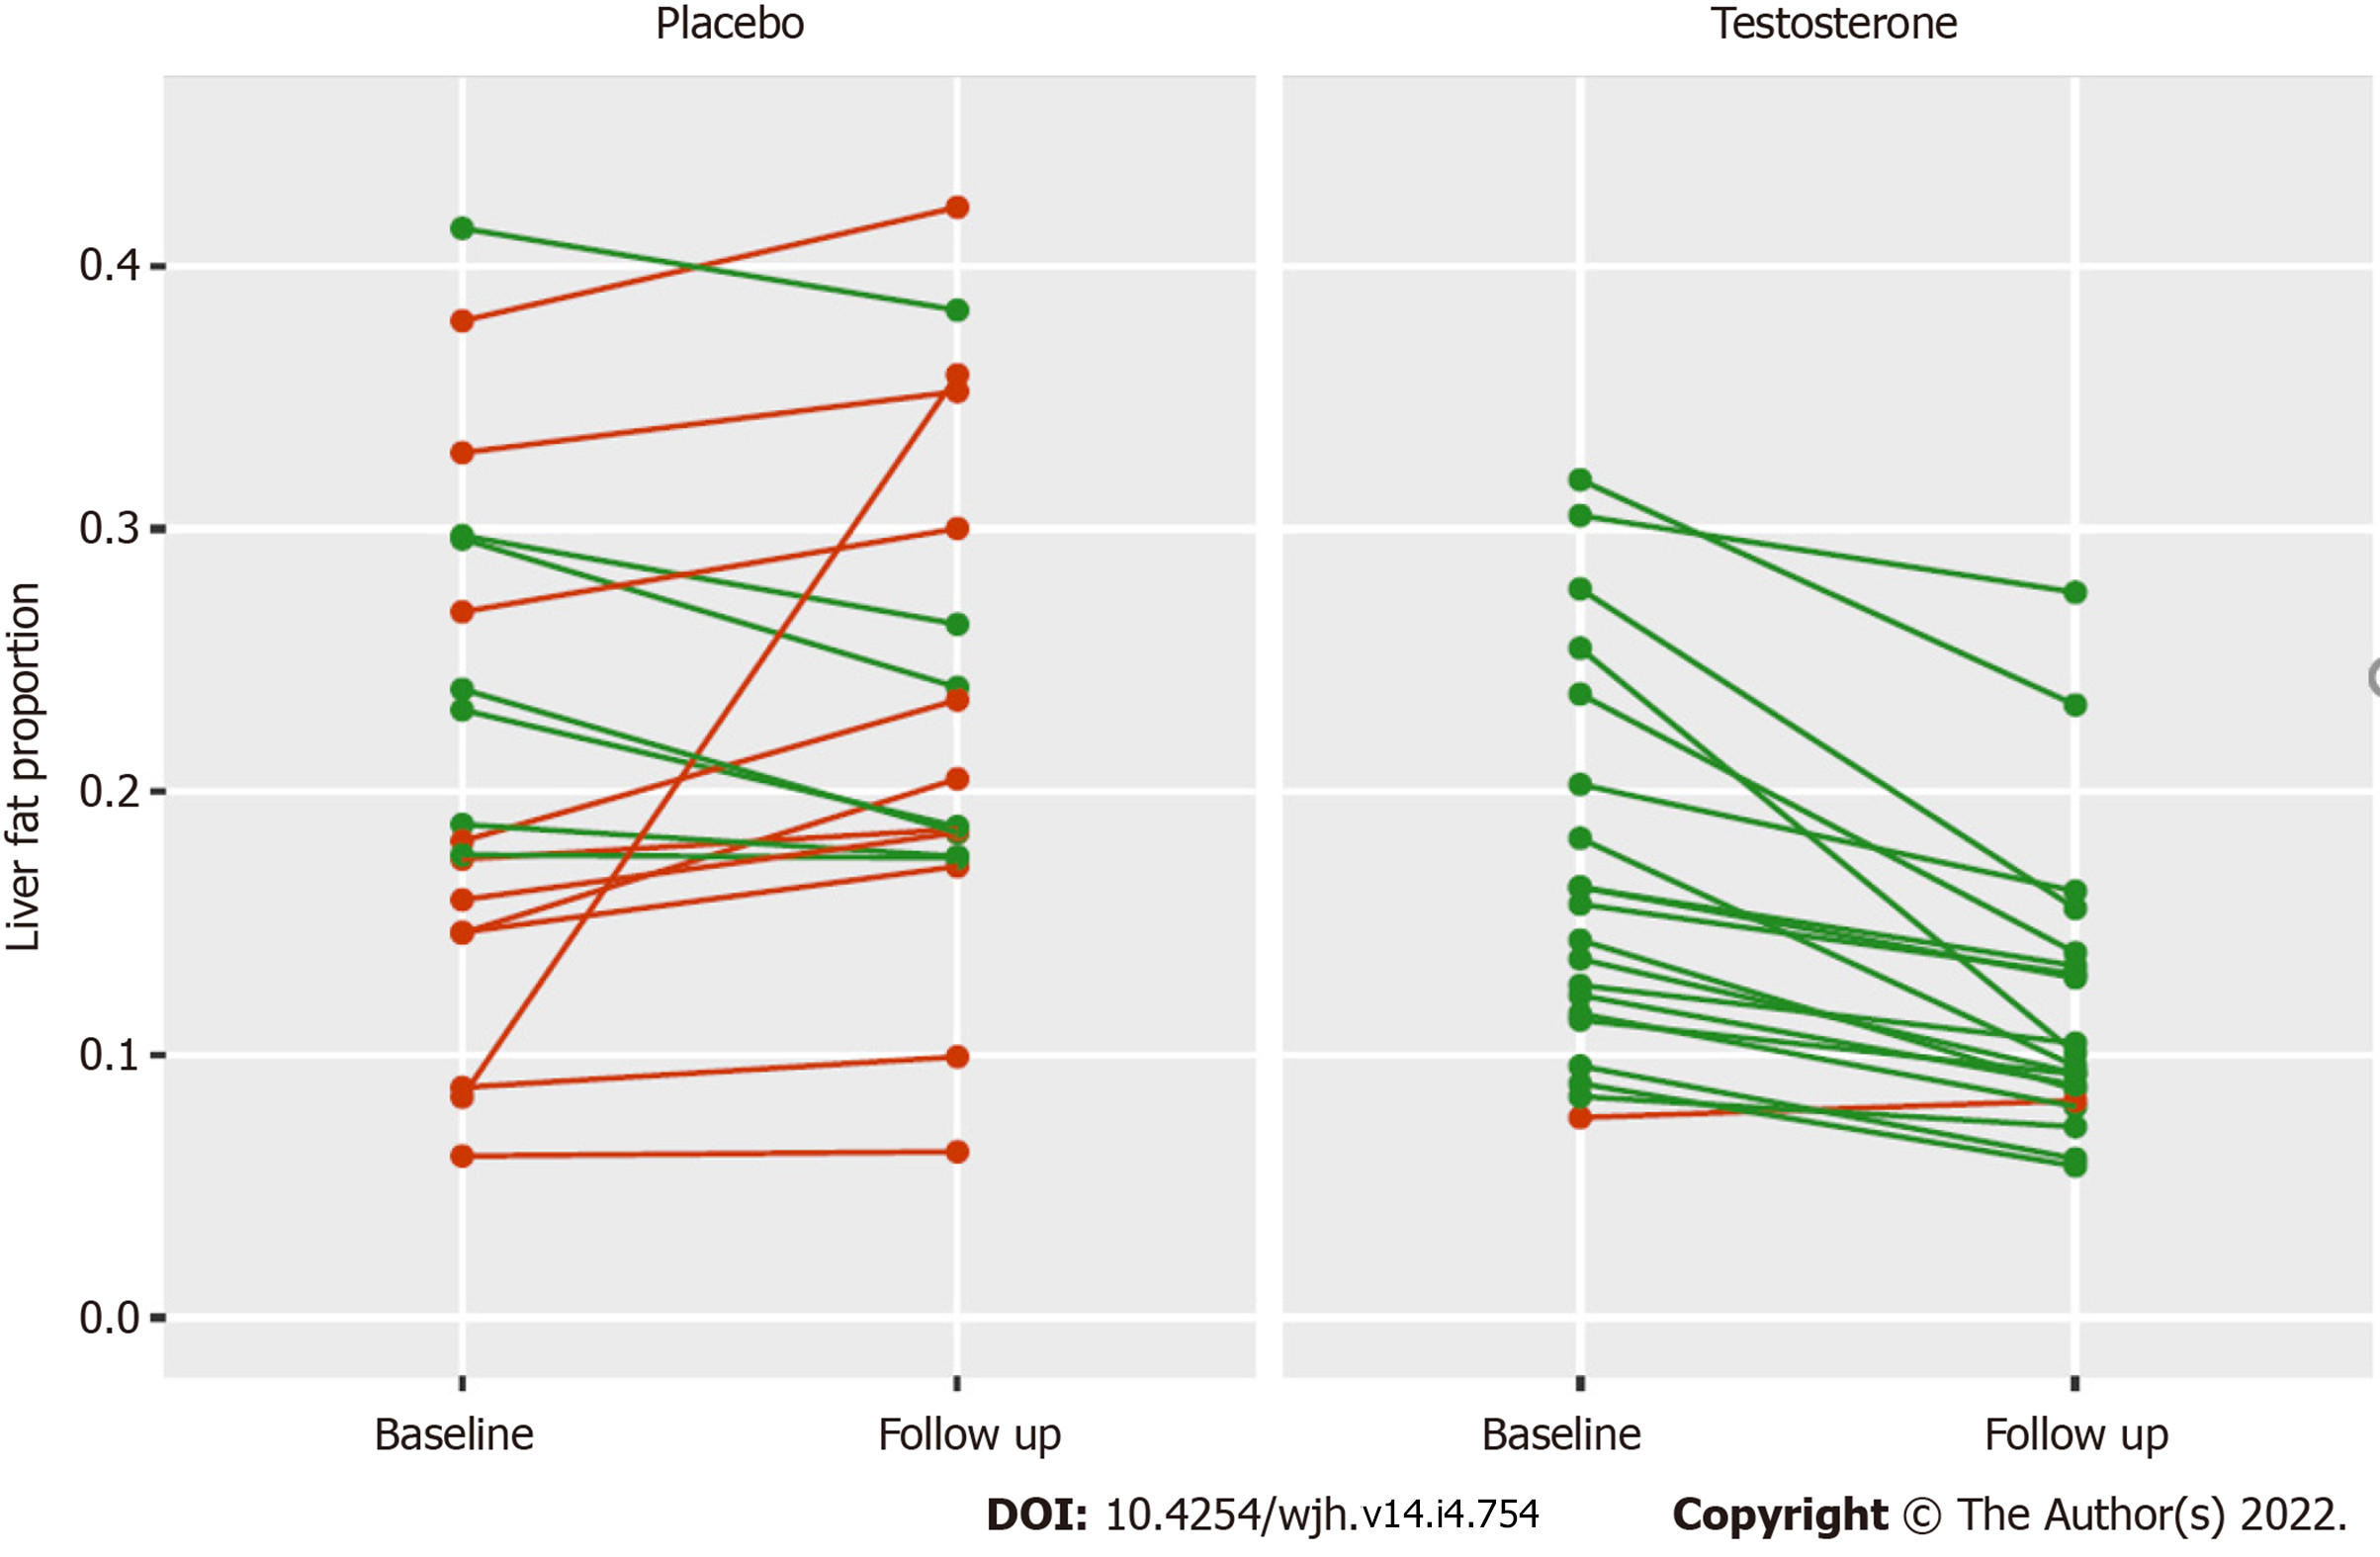
Figure 1 Absolute change in liver fat in all patients receiving placebo and testosterone therapy from baseline to 40 wk follow up, reported as proportion of fat.
Lines connect observations from the same participant. Red indicates an increase, green a decrease in liver fat proportion.
- Citation: Apostolov R, Gianatti E, Wong D, Kutaiba N, Gow P, Grossmann M, Sinclair M. Testosterone therapy reduces hepatic steatosis in men with type 2 diabetes and low serum testosterone concentrations. World J Hepatol 2022; 14(4): 754-765
- URL: https://www.wjgnet.com/1948-5182/full/v14/i4/754.htm
- DOI: https://dx.doi.org/10.4254/wjh.v14.i4.754


