Copyright
©The Author(s) 2022.
World J Hepatol. Apr 27, 2022; 14(4): 729-743
Published online Apr 27, 2022. doi: 10.4254/wjh.v14.i4.729
Published online Apr 27, 2022. doi: 10.4254/wjh.v14.i4.729
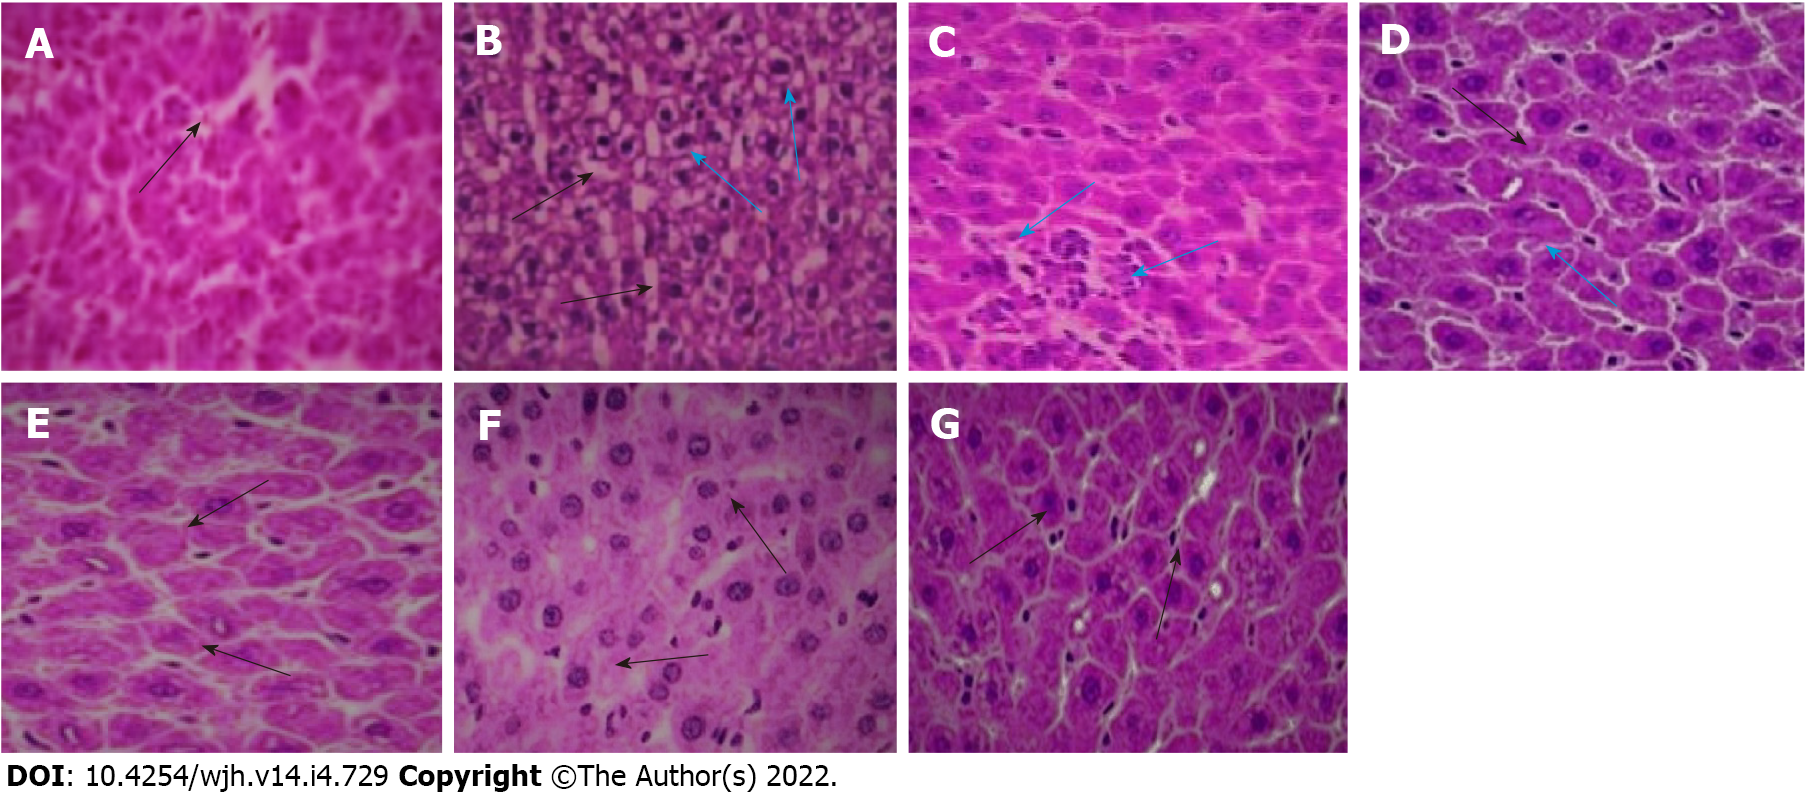
Figure 6 Histological sections of rat liver.
A: Normal control (the black arrow shows normal intercellular spaces and negligible vacuolation); B: Fluoxetine (10 mg/kg) treated (the black arrows show increased vacuolation and cellular degeneration, blue arrows indicate presence of inflammatory cells); C: Fluoxetine + baicalin (50 mg/kg) treated (blue arrows indicate a patch of inflammatory cell infiltration); D: Fluoxetine + baicalin (100 mg/kg) treated (the black arrow depicts regular cellular pattern and normal sinusoidal space, blue arrow indicates fewer inflammatory cells); E: Fluoxetine + silymarin (100 mg/kg) treated (the black arrows show normal cells and intercellular spaces similar to normal control); F: Baicalin (100 mg/kg) treated (the black arrows show normal cellular structure); G: Silymarin (100 mg/kg) treated (the black arrows depict normal cells and intercellular spaces).
- Citation: Ganguly R, Kumar R, Pandey AK. Baicalin provides protection against fluoxetine-induced hepatotoxicity by modulation of oxidative stress and inflammation. World J Hepatol 2022; 14(4): 729-743
- URL: https://www.wjgnet.com/1948-5182/full/v14/i4/729.htm
- DOI: https://dx.doi.org/10.4254/wjh.v14.i4.729


