Copyright
©The Author(s) 2022.
World J Hepatol. Nov 27, 2022; 14(11): 1977-1984
Published online Nov 27, 2022. doi: 10.4254/wjh.v14.i11.1977
Published online Nov 27, 2022. doi: 10.4254/wjh.v14.i11.1977
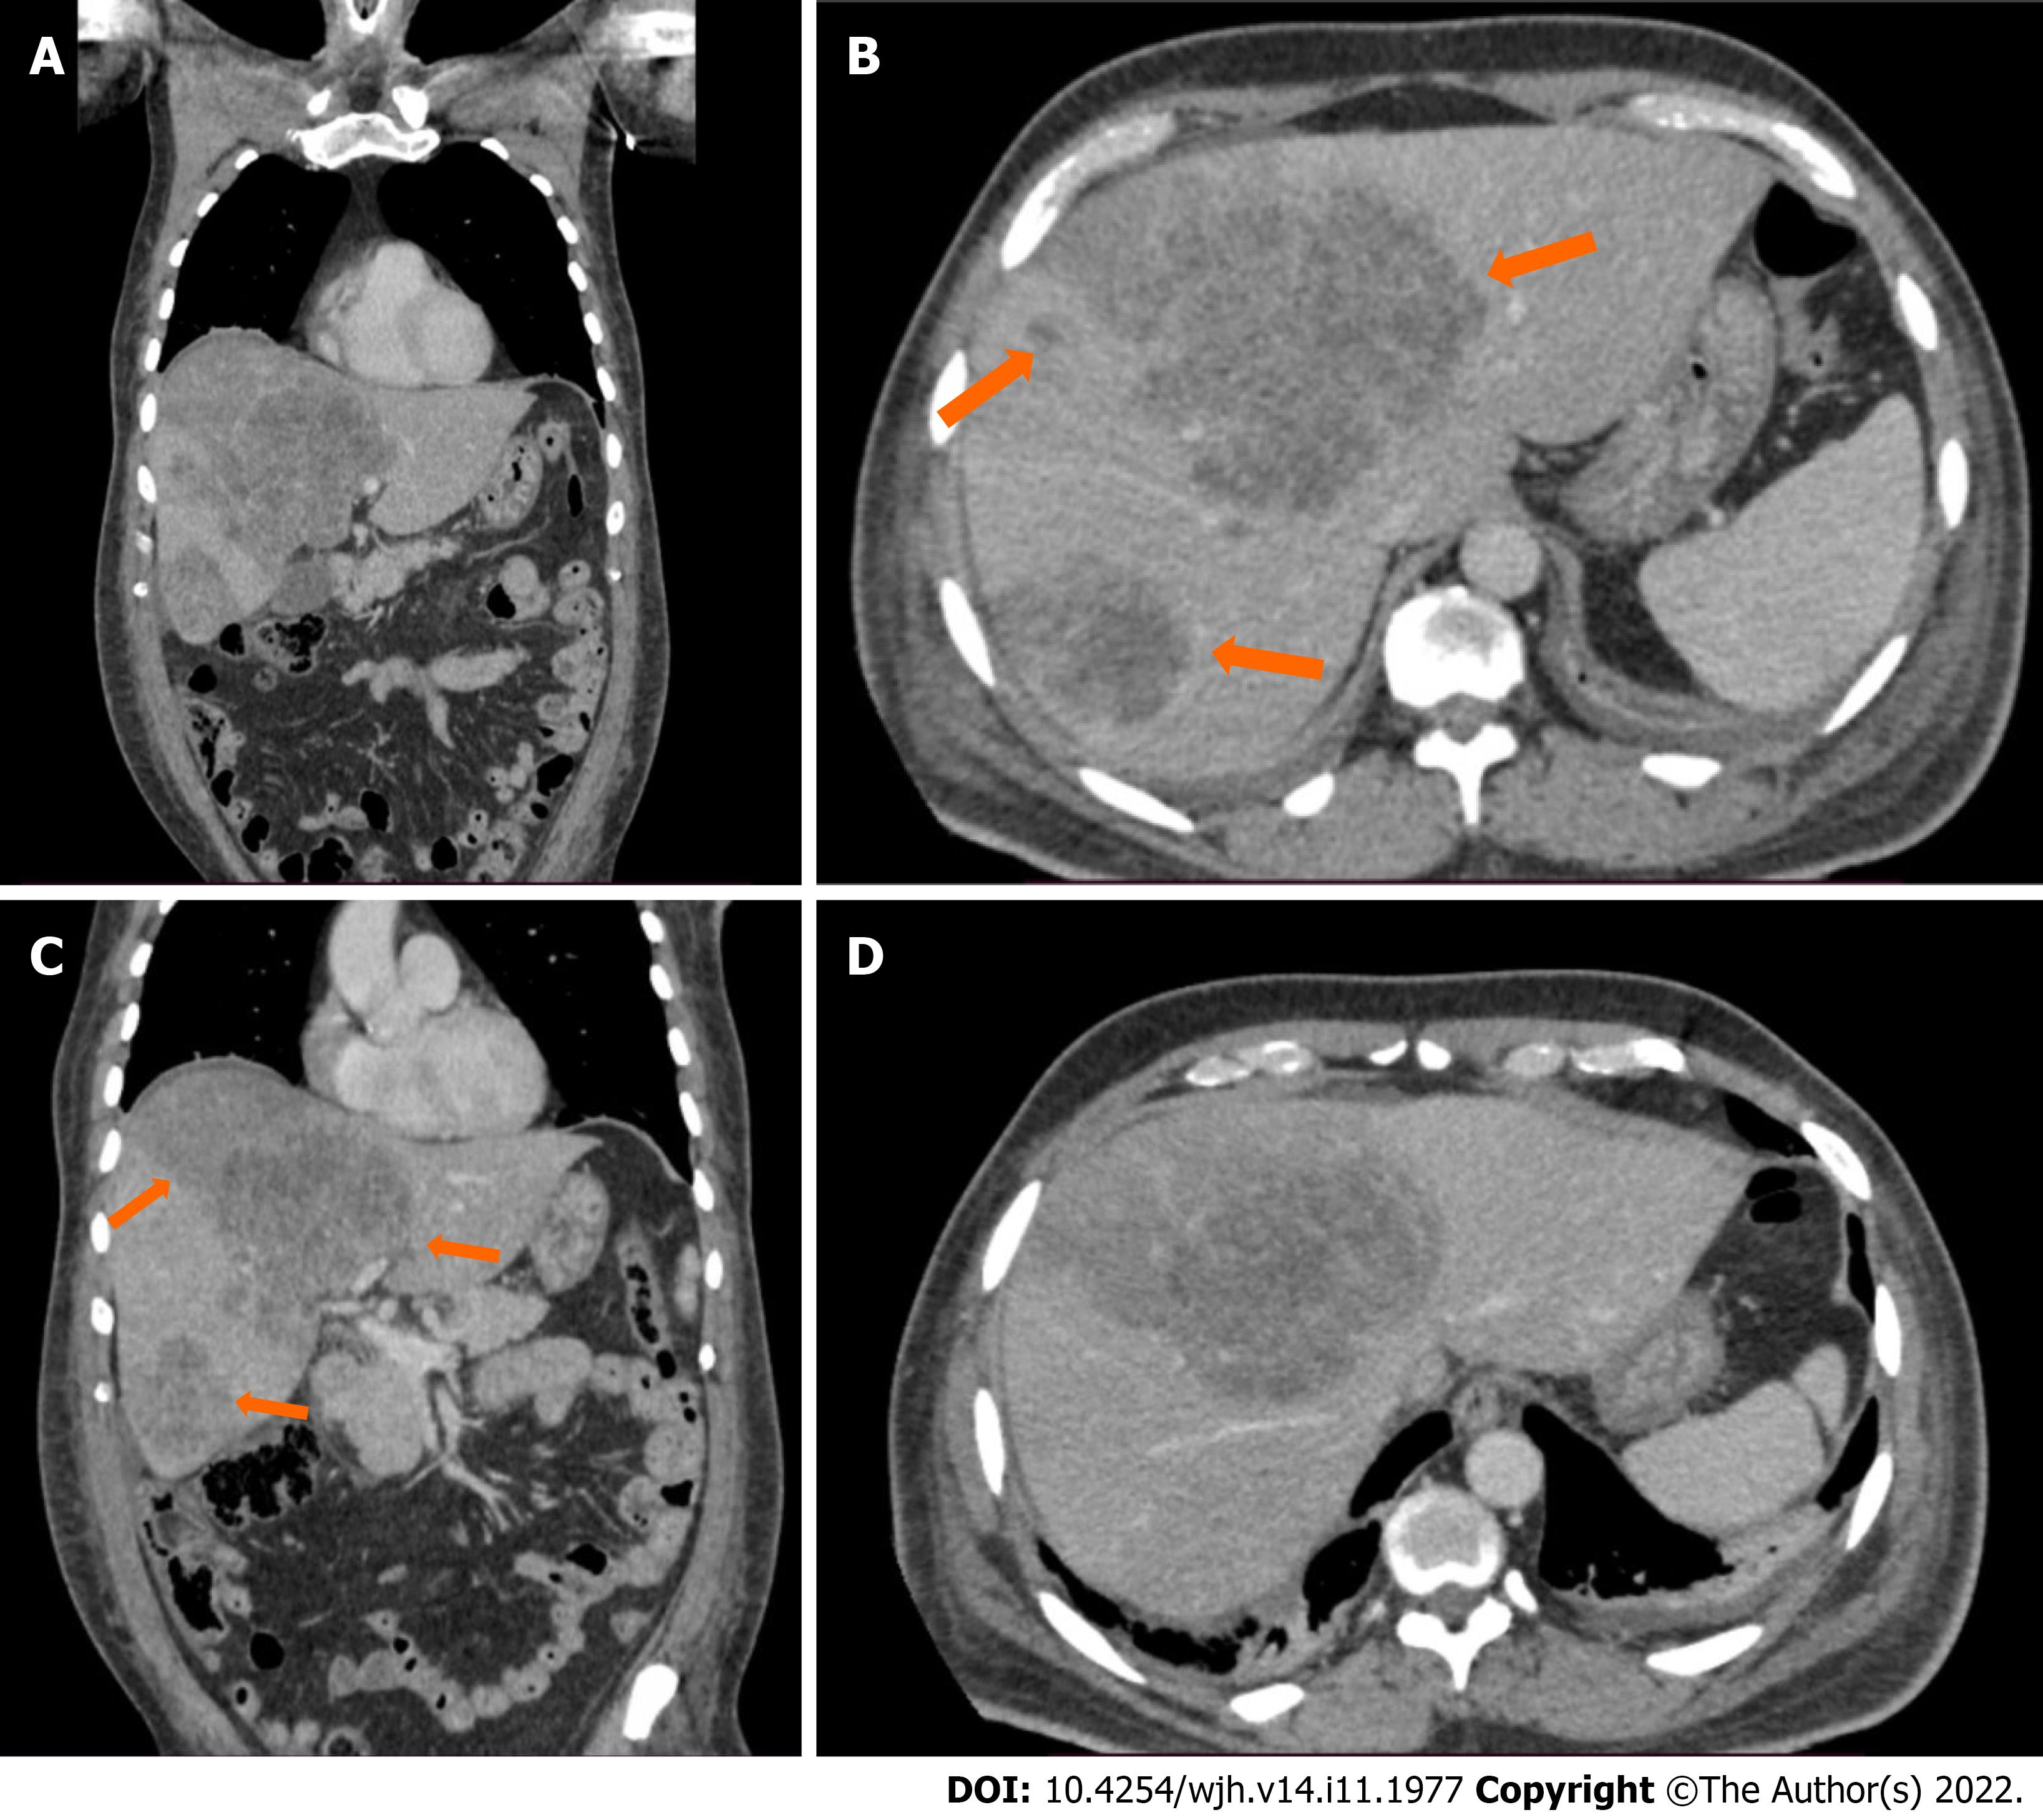
Figure 1 Computed tomography scan of the liver.
A: Coronal view of the portal phase, showing multiple nodular lesions in both lobes of the liver; B: Axial view of the portal phase, showing multiple nodular lesions in both lobes of the liver, with discrete peripheral enhancement; C: Coronal view of the portal phase, showing the marked and linear transition from the wedge-shaped area of infarction and adjacent liver parenchyma; D: Axial view of the portal phase, showing the marked and linear transition from the wedge-shaped area of infarction and adjacent liver parenchyma.
- Citation: Gomes VMDS, Ferreira GSA, Barros LCTR, Santos BMRTD, Vieira LPB. Multiple hepatic infarctions secondary to diabetic ketoacidosis: A case report. World J Hepatol 2022; 14(11): 1977-1984
- URL: https://www.wjgnet.com/1948-5182/full/v14/i11/1977.htm
- DOI: https://dx.doi.org/10.4254/wjh.v14.i11.1977


