Copyright
©The Author(s) 2022.
World J Hepatol. Nov 27, 2022; 14(11): 1964-1976
Published online Nov 27, 2022. doi: 10.4254/wjh.v14.i11.1964
Published online Nov 27, 2022. doi: 10.4254/wjh.v14.i11.1964
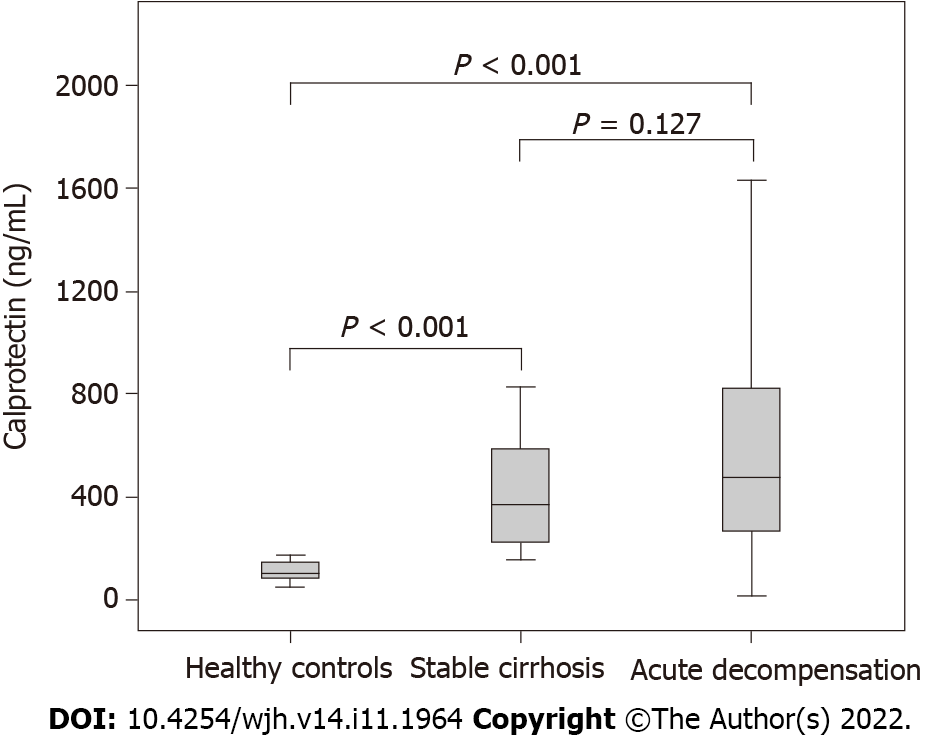
Figure 1 Box plot of serum calprotectin levels among healthy controls, stable cirrhostics, and hospitalized cirrhotics with acute decompensation.
The line across the box indicates the median value; the box contains the 25% to 75% interquartile range; and the whiskers represent the highest and the lower values. There were no differences in calprotectin levels between patients with acute decompensation and stable cirrhosis patients (P = 0.127). Significantly lower calprotectin levels were observed among healthy controls compared to stable cirrhosis (P < 0.001) and patients with acute decompensation (P < 0.001).
- Citation: Matiollo C, Rateke ECM, Moura EQA, Andrigueti M, Augustinho FC, Zocche TL, Silva TE, Gomes LO, Farias MR, Narciso-Schiavon JL, Schiavon LL. Elevated calprotectin levels are associated with mortality in patients with acute decompensation of liver cirrhosis. World J Hepatol 2022; 14(11): 1964-1976
- URL: https://www.wjgnet.com/1948-5182/full/v14/i11/1964.htm
- DOI: https://dx.doi.org/10.4254/wjh.v14.i11.1964


