Copyright
©The Author(s) 2022.
World J Hepatol. Oct 27, 2022; 14(10): 1884-1898
Published online Oct 27, 2022. doi: 10.4254/wjh.v14.i10.1884
Published online Oct 27, 2022. doi: 10.4254/wjh.v14.i10.1884
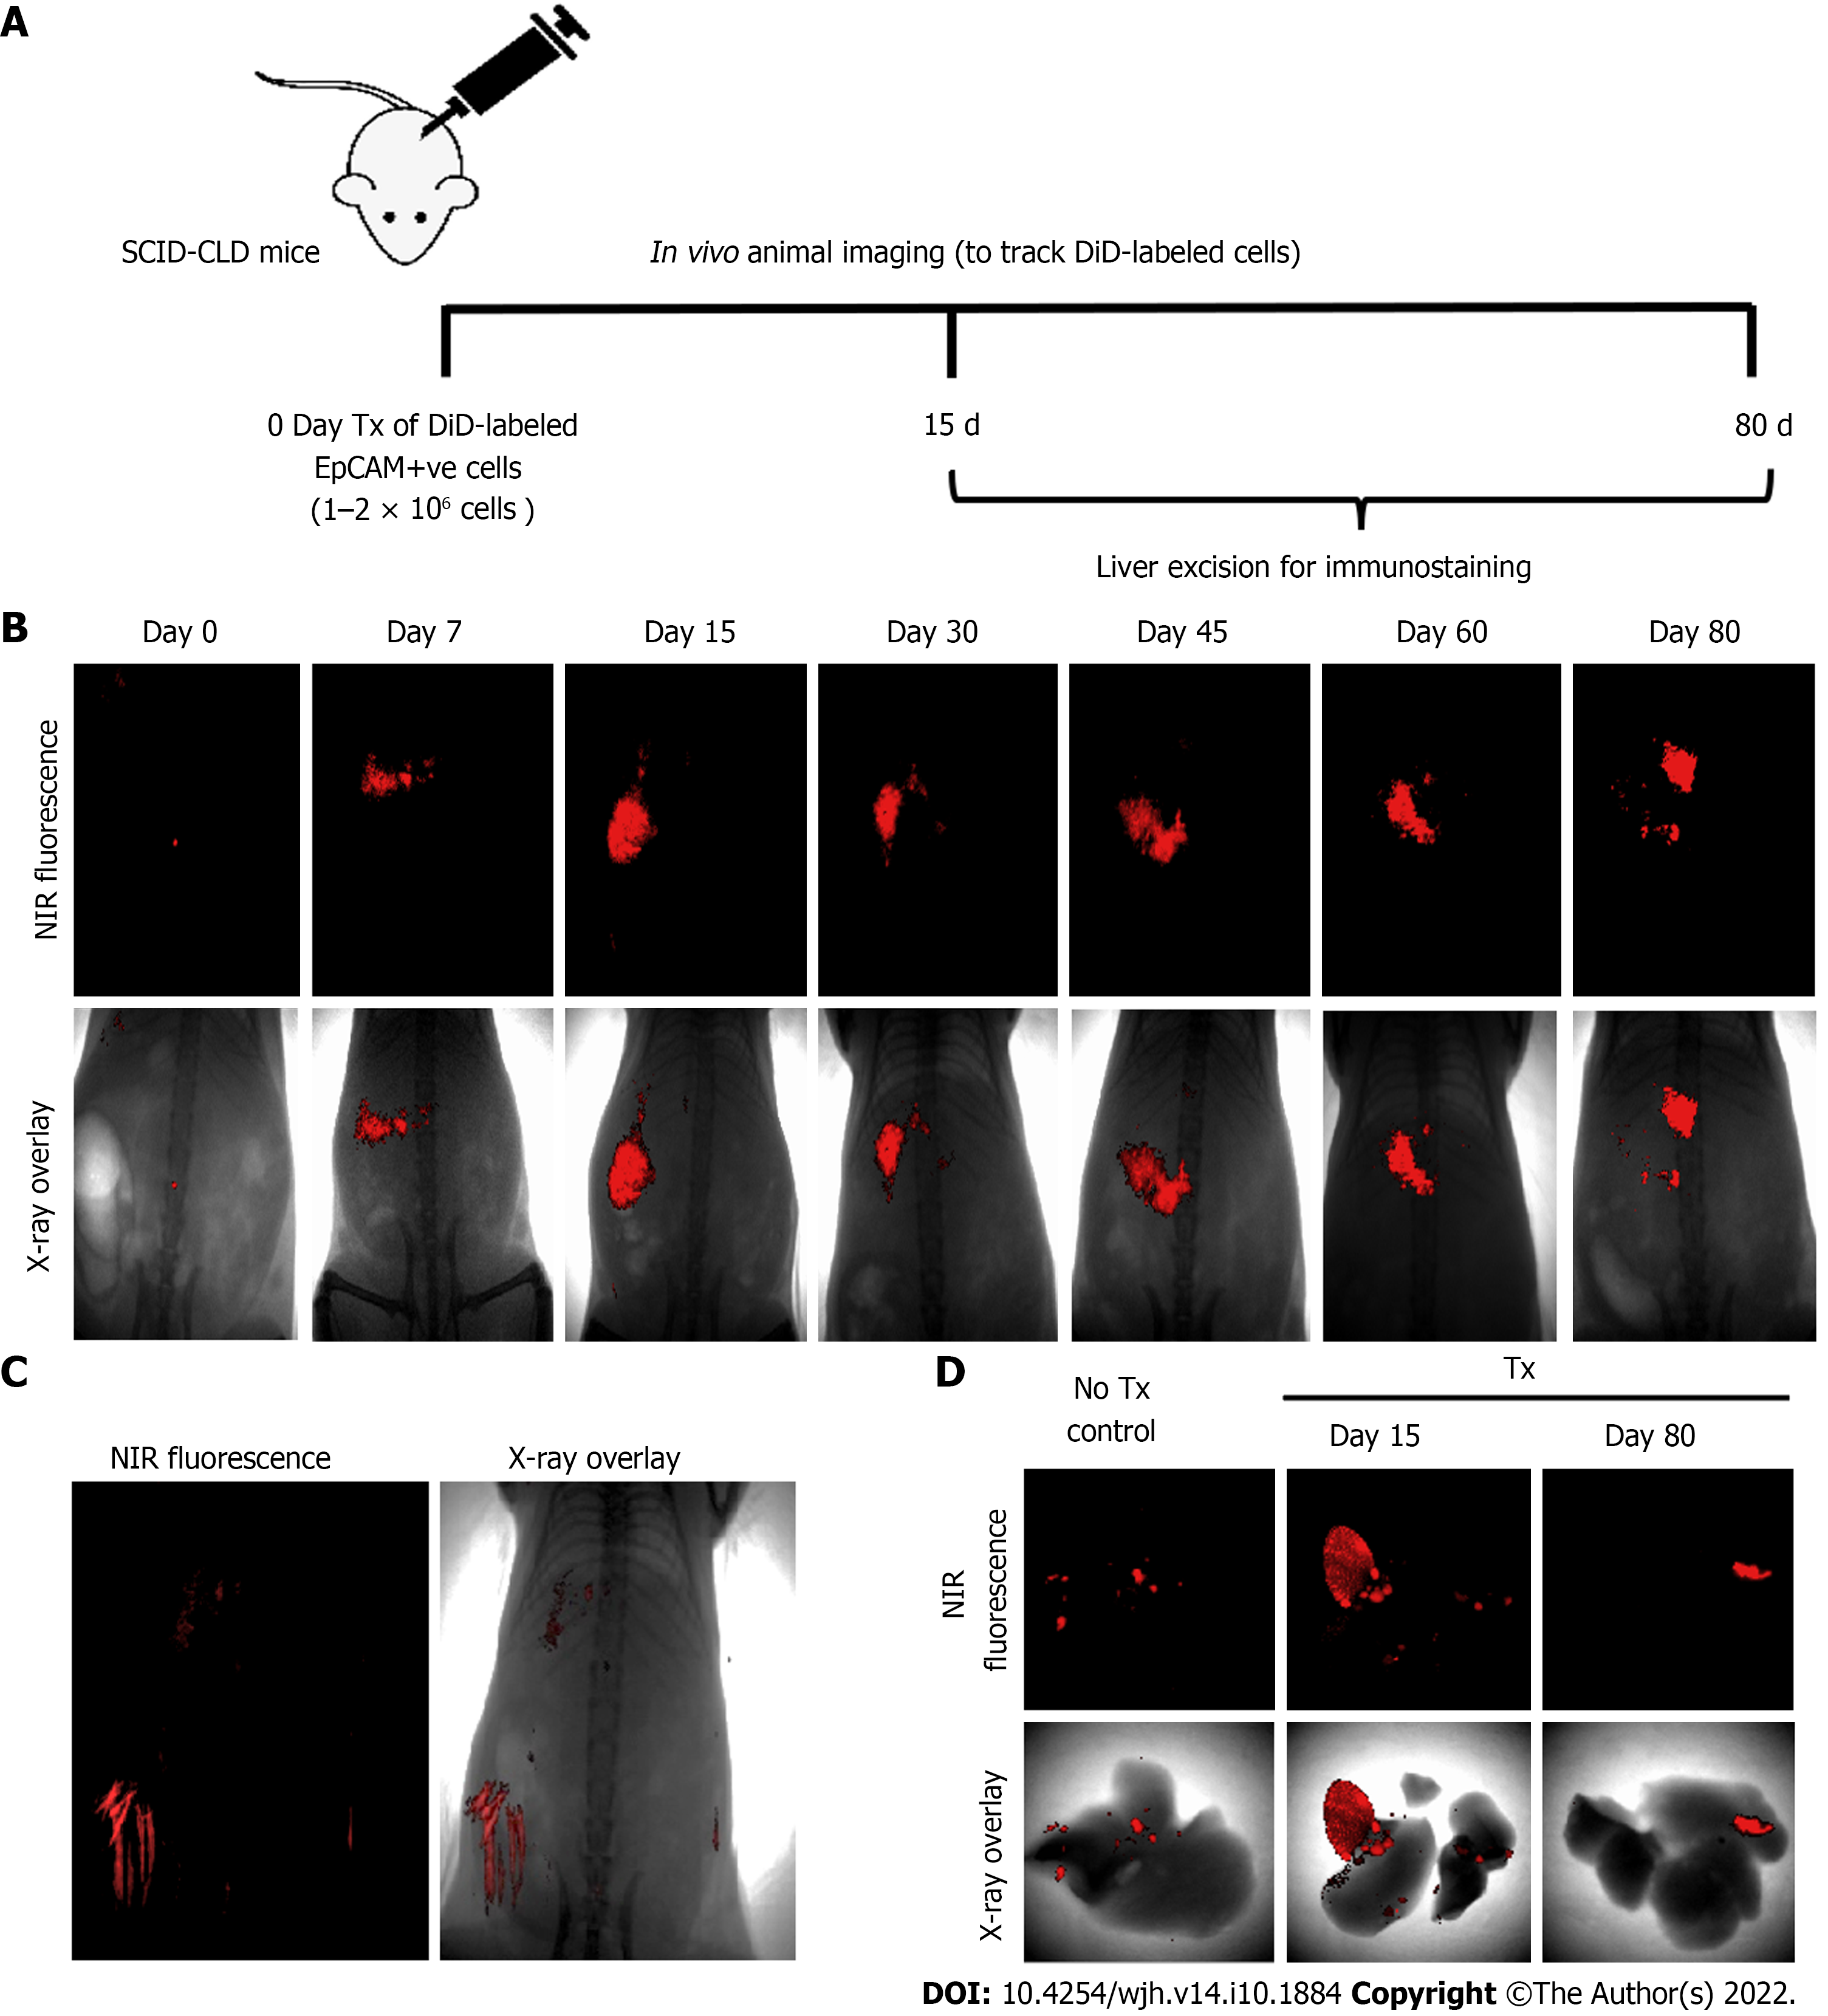
Figure 3 Long-term in vivo tracking of transplanted cells.
A: Schematic representation showing the timeline for cell transplantation in mice with chronic liver diseases, imaging, and animal sacrifice; B: In vivo near-infrared (NIR)-fluorescence images (top panel) overlay with X-ray images (lower panel) of mice post-transplantation at indicated time periods; C: NIR-fluorescence image overlay with X-ray image of non-transplanted control mice (hair autofluorescence can be seen); D: Ex vivo imaging of excised livers of non-transplant control mice and transplanted mice at 15 and 80 d post-transplantation.
- Citation: Tripura C, Gunda S, Vishwakarma SK, Thatipalli AR, Jose J, Jerald MK, Khan AA, Pande G. Long-term and non-invasive in vivo tracking of DiD dye-labeled human hepatic progenitors in chronic liver disease models. World J Hepatol 2022; 14(10): 1884-1898
- URL: https://www.wjgnet.com/1948-5182/full/v14/i10/1884.htm
- DOI: https://dx.doi.org/10.4254/wjh.v14.i10.1884


