Copyright
©The Author(s) 2021.
World J Hepatol. Aug 27, 2021; 13(8): 939-948
Published online Aug 27, 2021. doi: 10.4254/wjh.v13.i8.939
Published online Aug 27, 2021. doi: 10.4254/wjh.v13.i8.939
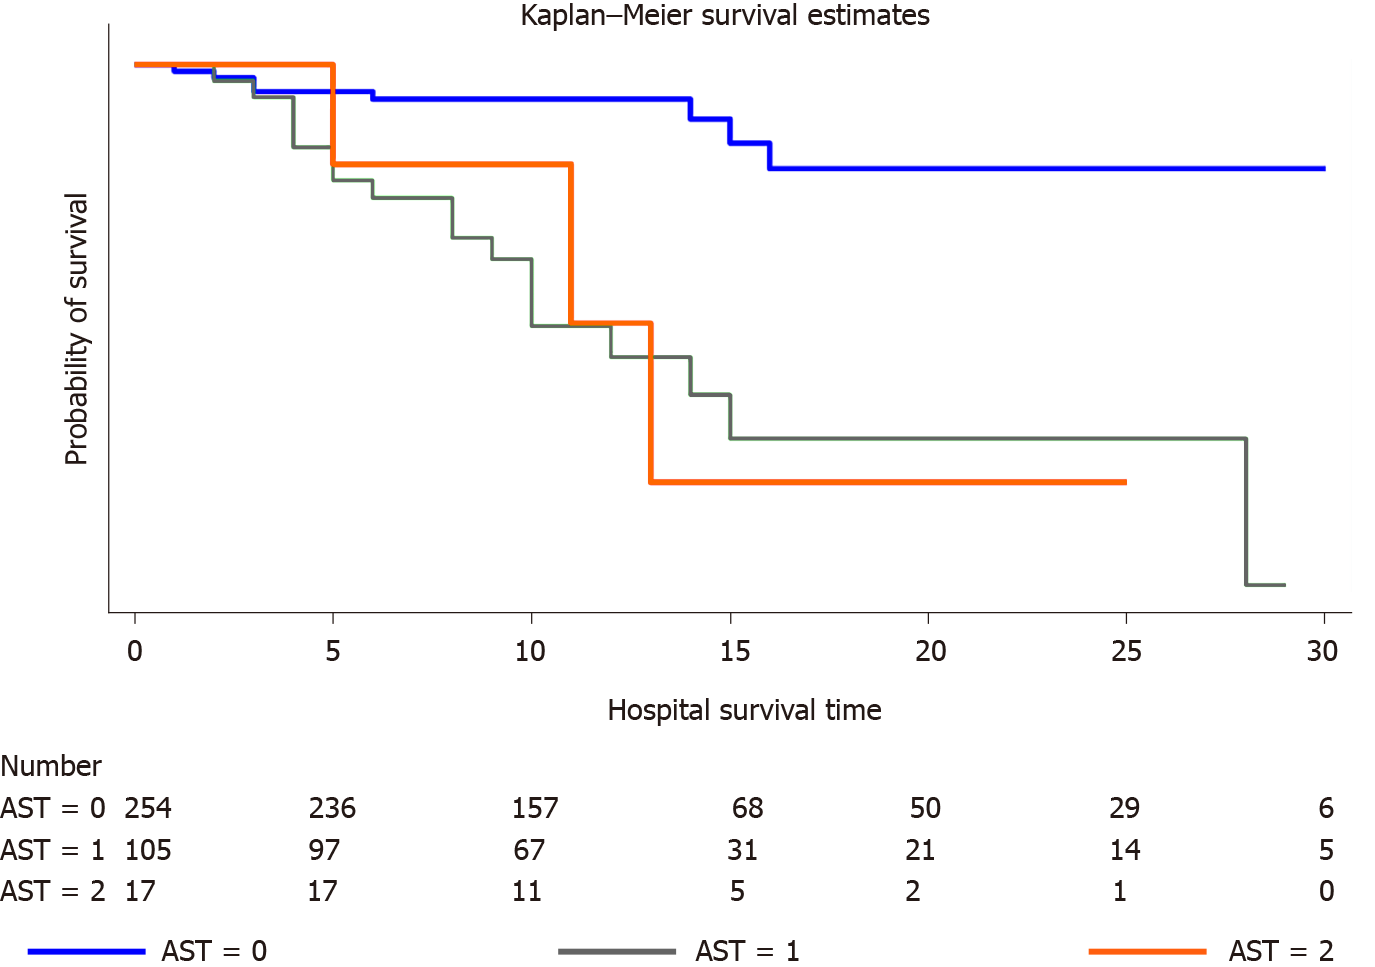
Figure 2 Kaplan–Meier curves.
Survival curves show probability of survival (days) for aspartate aminotransferase (AST) groups, tested by log-rank test. AST = 0: Group with normal AST; AST = 1: Group with one-fold elevated AST; AST = 2: Group with two-fold elevated AST.
- Citation: Madian A, Eliwa A, Abdalla H, Aly HAA. Hepatocellular injury and the mortality risk among patients with COVID-19: A retrospective cohort study. World J Hepatol 2021; 13(8): 939-948
- URL: https://www.wjgnet.com/1948-5182/full/v13/i8/939.htm
- DOI: https://dx.doi.org/10.4254/wjh.v13.i8.939


