Copyright
©The Author(s) 2021.
World J Hepatol. May 27, 2021; 13(5): 543-556
Published online May 27, 2021. doi: 10.4254/wjh.v13.i5.543
Published online May 27, 2021. doi: 10.4254/wjh.v13.i5.543
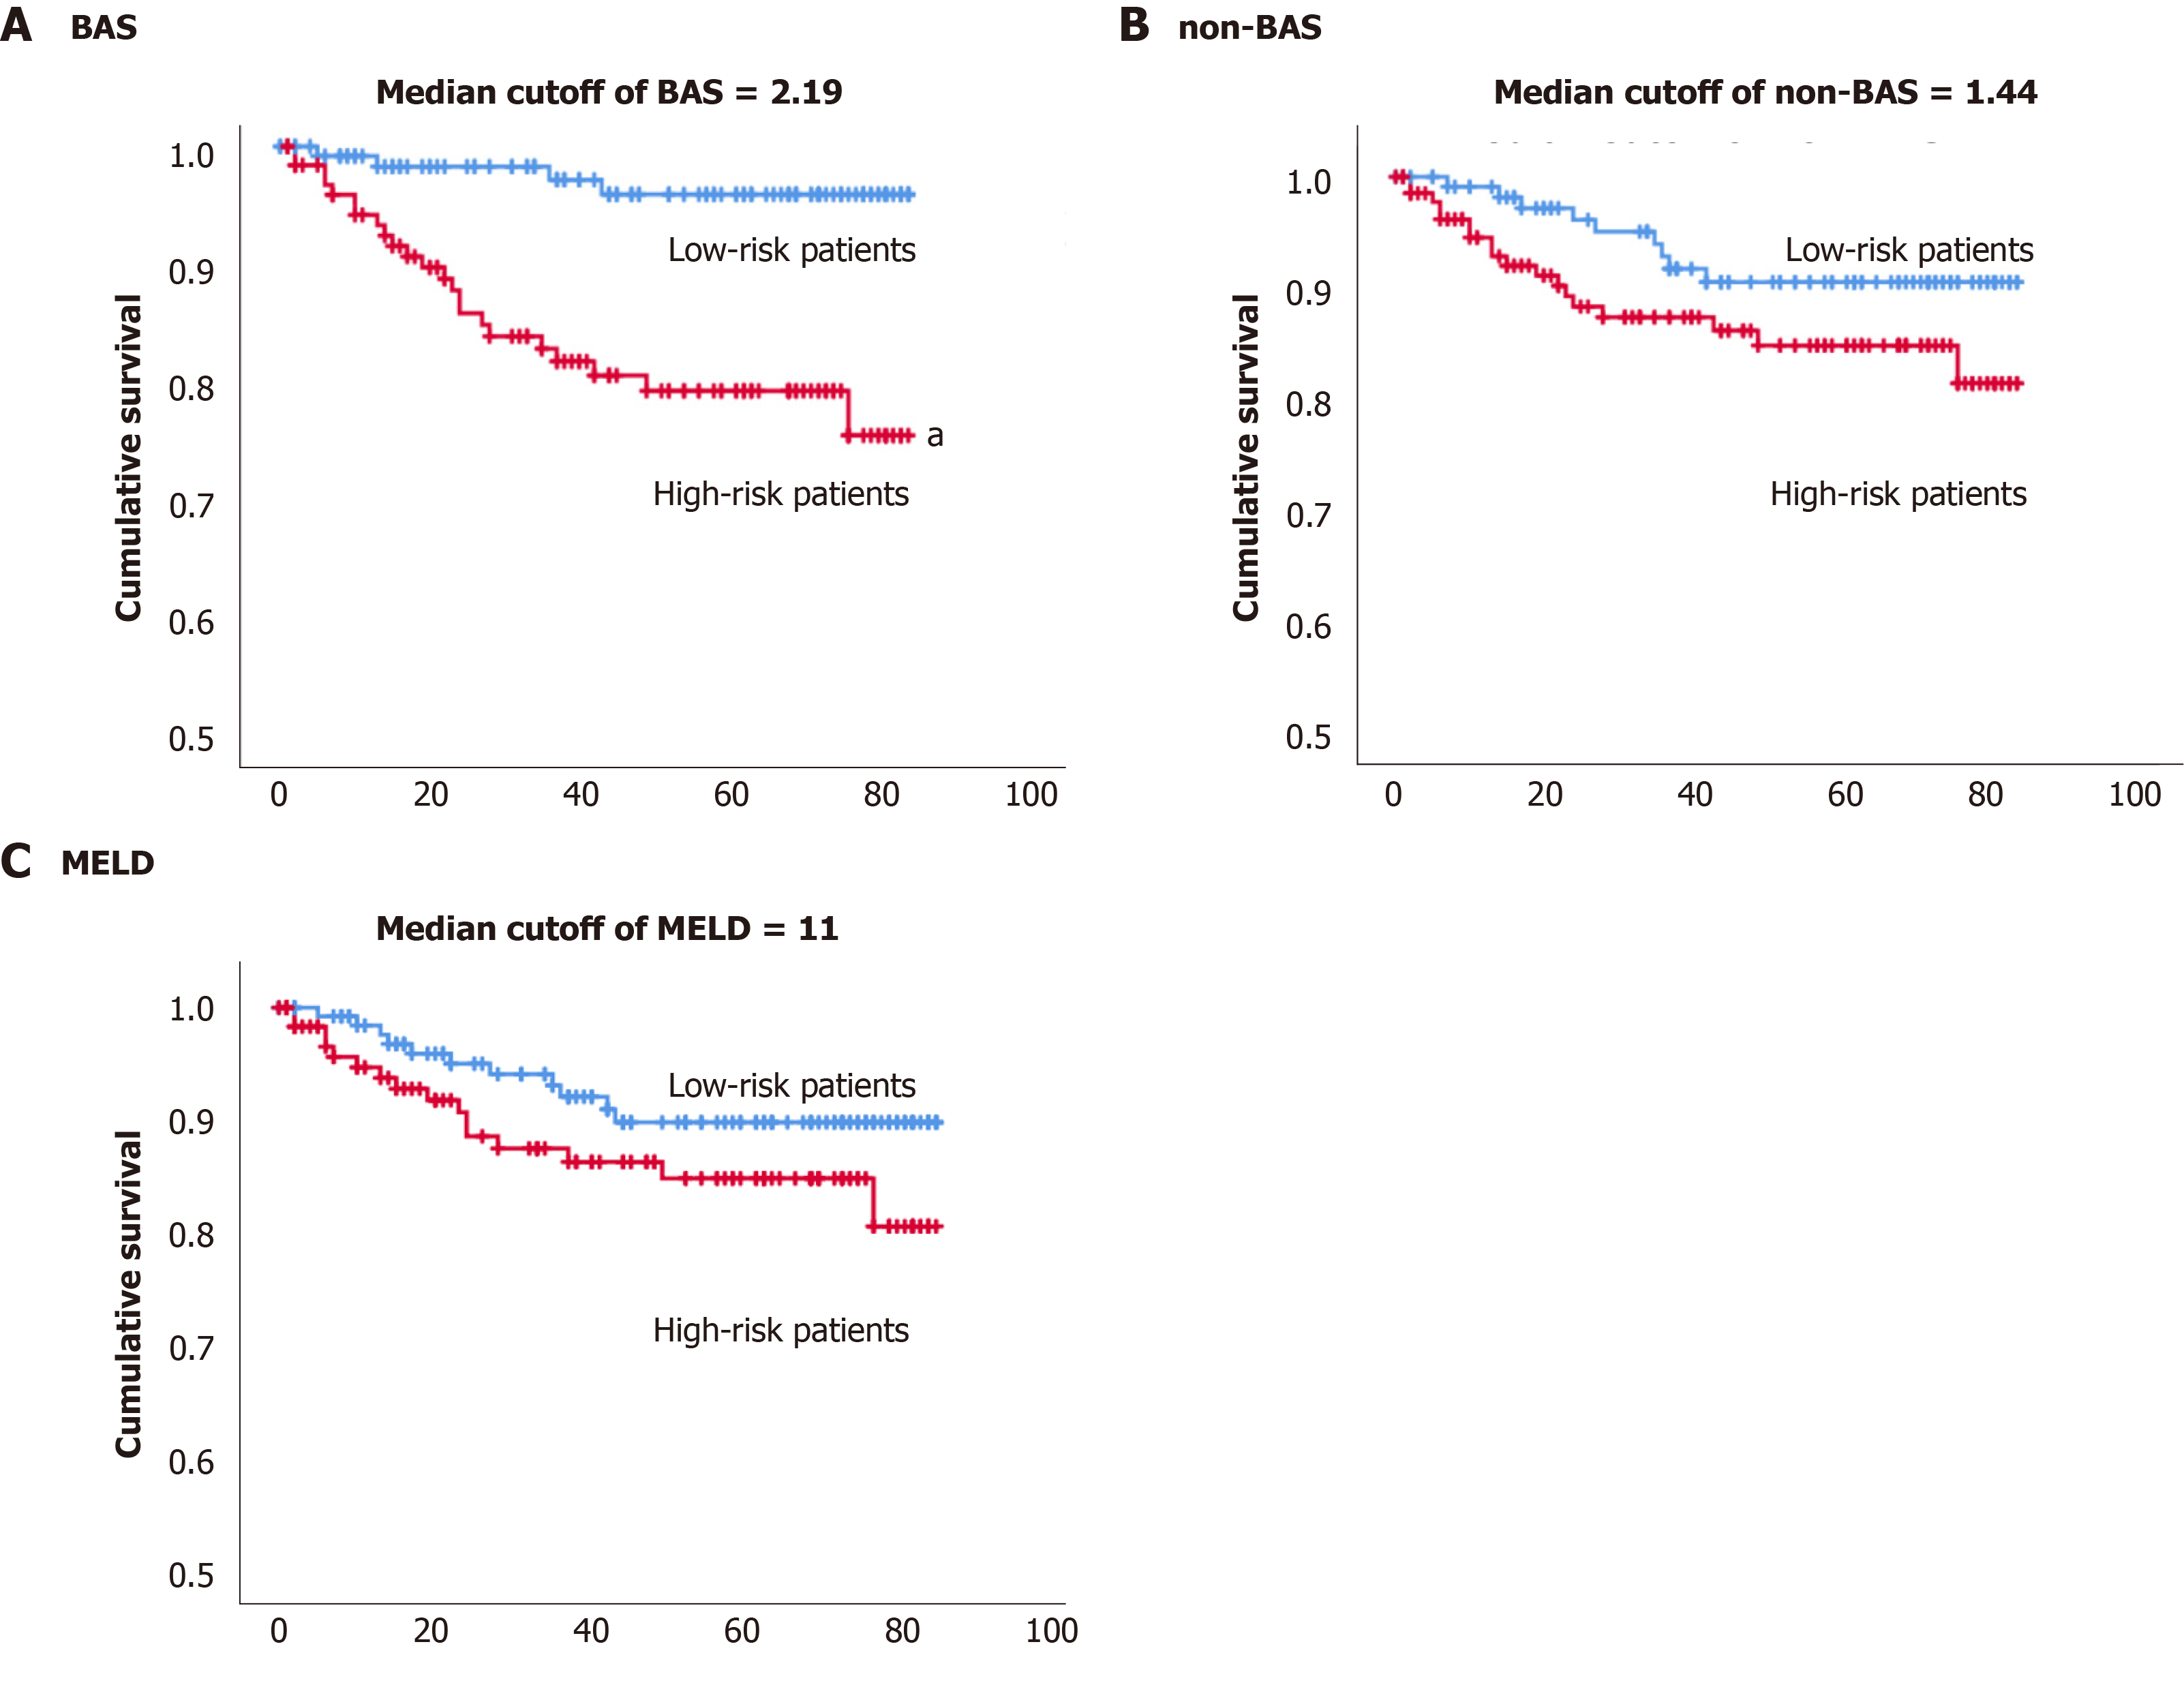
Figure 3 Kaplan-Meier survival plots for high vs low bile-acids score, non- bile-acids score, and models for end stage liver diseases.
aP value < 0.05 from the Log rank and Breslow tests. A: The median cutoff value of the bile-acids score (BAS) was used to define high vs low risk of death; B: The median cutoff value of the non-BAS was used to define high vs low risk of death; C: The median cutoff value of the model for end stage liver diseases was used to define high vs low risk of death. BAS: Bile-acids score; MELD: Model for end stage liver diseases.
- Citation: Alamoudi JA, Li W, Gautam N, Olivera M, Meza J, Mukherjee S, Alnouti Y. Bile acid indices as biomarkers for liver diseases II: The bile acid score survival prognostic model. World J Hepatol 2021; 13(5): 543-556
- URL: https://www.wjgnet.com/1948-5182/full/v13/i5/543.htm
- DOI: https://dx.doi.org/10.4254/wjh.v13.i5.543


