Copyright
©The Author(s) 2021.
World J Hepatol. Dec 27, 2021; 13(12): 2052-2070
Published online Dec 27, 2021. doi: 10.4254/wjh.v13.i12.2052
Published online Dec 27, 2021. doi: 10.4254/wjh.v13.i12.2052
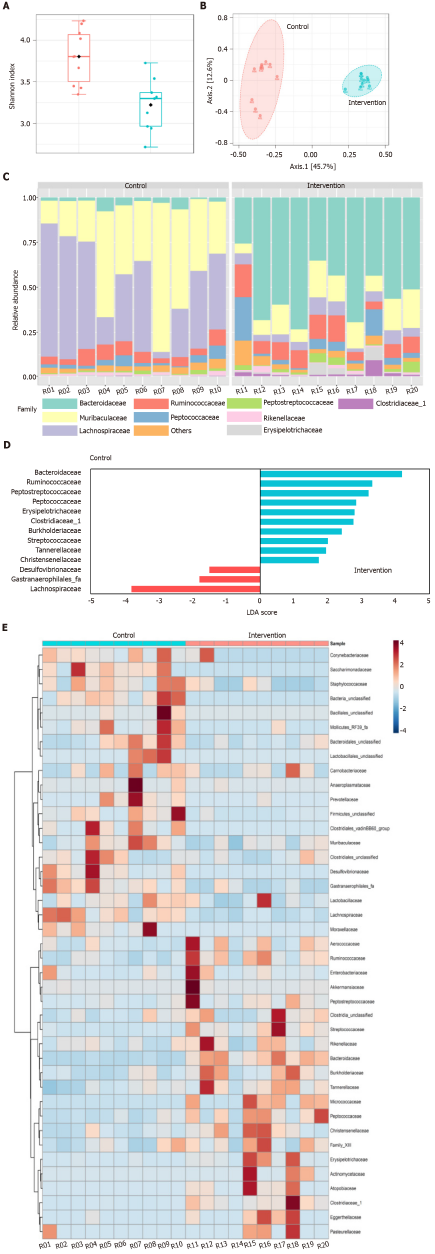
Figure 3 Gut microbiota changes in intervention and control groups.
A: Shannon diversity index; B: Principal coordinate analysis based on Bray-Curtis distance metric; C: Relative abundance of gut microbiota at the family level; D: Differential abundance by linear discriminant analysis; E: Heatmap distribution of the 41 families among the samples. LDA: Linear discriminant analysis.
- Citation: Longo L, Rampelotto PH, Filippi-Chiela E, de Souza VEG, Salvati F, Cerski CT, da Silveira TR, Oliveira CP, Uribe-Cruz C, Álvares-da-Silva MR. Gut dysbiosis and systemic inflammation promote cardiomyocyte abnormalities in an experimental model of steatohepatitis. World J Hepatol 2021; 13(12): 2052-2070
- URL: https://www.wjgnet.com/1948-5182/full/v13/i12/2052.htm
- DOI: https://dx.doi.org/10.4254/wjh.v13.i12.2052


