Copyright
©The Author(s) 2021.
World J Hepatol. Dec 27, 2021; 13(12): 1892-1908
Published online Dec 27, 2021. doi: 10.4254/wjh.v13.i12.1892
Published online Dec 27, 2021. doi: 10.4254/wjh.v13.i12.1892
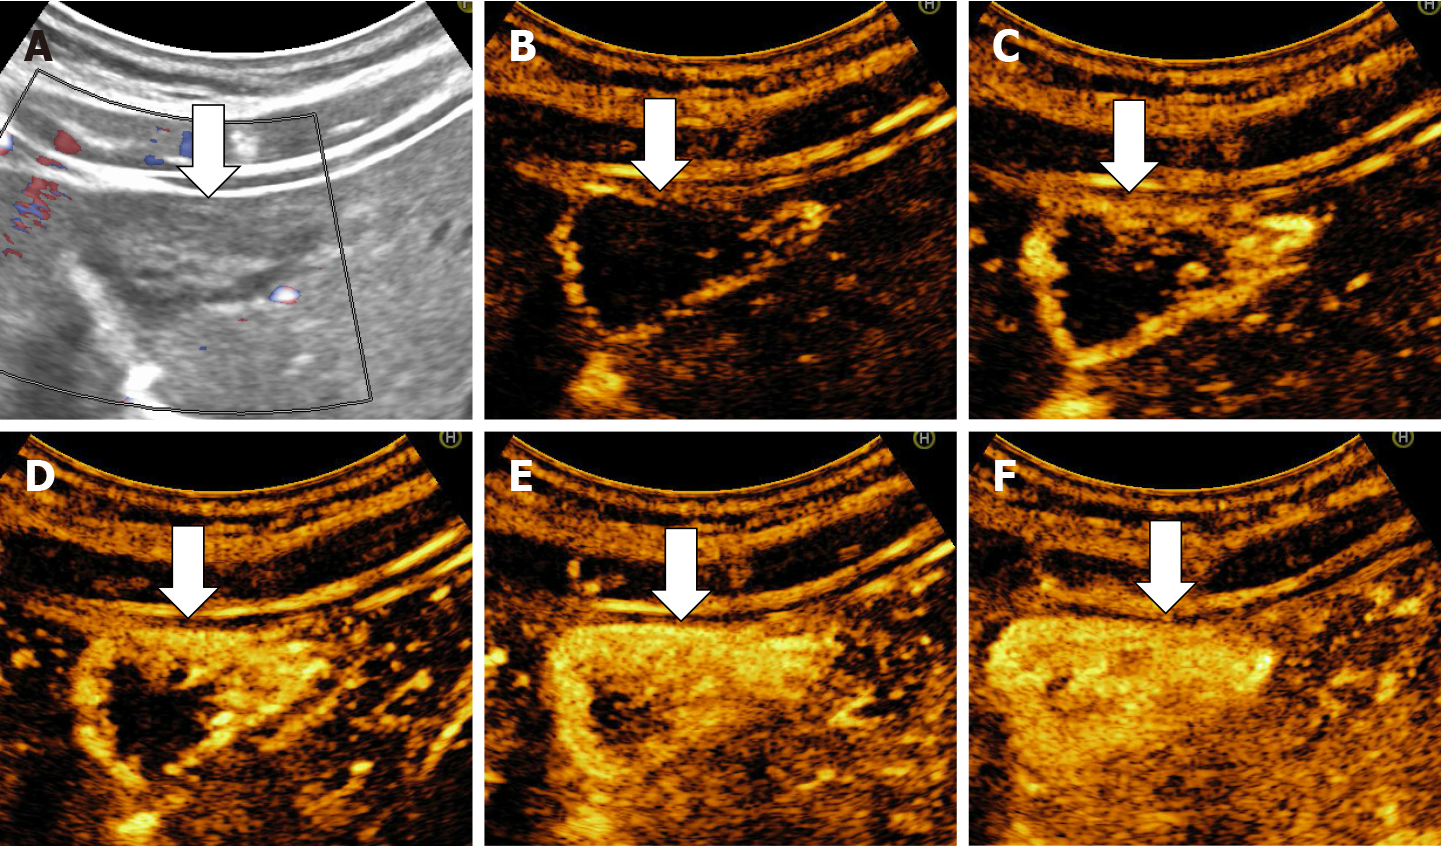
Figure 9 Example of hepatic hemangioma with inhomogeneous echogenicity.
A: Gray scale ultrasound; B-E: On contrast enhanced ultrasound the hemangioma shows the typical peripheral nodular contrast enhancement (B and C) and centripetal fill-in (D and E); F: The mass shows strong homogenous enhancement in the late phase.
- Citation: Sandulescu LD, Urhut CM, Sandulescu SM, Ciurea AM, Cazacu SM, Iordache S. One stop shop approach for the diagnosis of liver hemangioma. World J Hepatol 2021; 13(12): 1892-1908
- URL: https://www.wjgnet.com/1948-5182/full/v13/i12/1892.htm
- DOI: https://dx.doi.org/10.4254/wjh.v13.i12.1892


