
















©The Author(s) 2020.
World J Hepatol. Jul 27, 2020; 12(7): 378-388
Published online Jul 27, 2020. doi: 10.4254/wjh.v12.i7.378
Published online Jul 27, 2020. doi: 10.4254/wjh.v12.i7.378
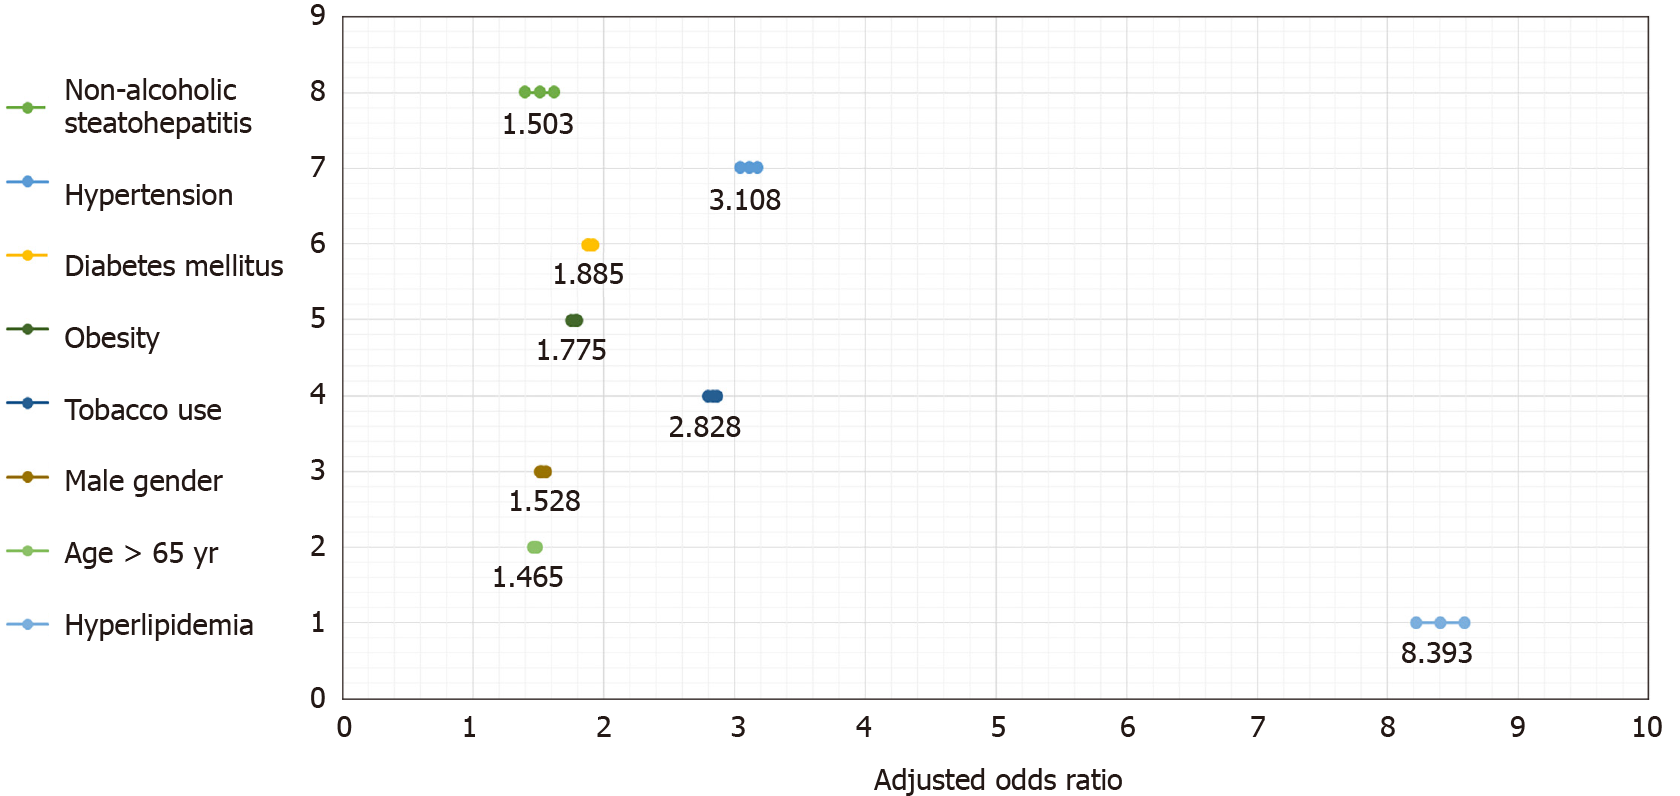
Figure 3 Forest plot showing adjusted odds ratio of having myocardial infarction.
The dots represent the odds ratio and the horizontal line represents the 95% confidence interval.
- Citation: Ghoneim S, Dhorepatil A, Shah AR, Ram G, Ahmad S, Kim C, Asaad I. Non-alcoholic steatohepatitis and the risk of myocardial infarction: A population-based national study. World J Hepatol 2020; 12(7): 378-388
- URL: https://www.wjgnet.com/1948-5182/full/v12/i7/378.htm
- DOI: https://dx.doi.org/10.4254/wjh.v12.i7.378