Copyright
©The Author(s) 2020.
World J Hepatol. Nov 27, 2020; 12(11): 1098-1114
Published online Nov 27, 2020. doi: 10.4254/wjh.v12.i11.1098
Published online Nov 27, 2020. doi: 10.4254/wjh.v12.i11.1098
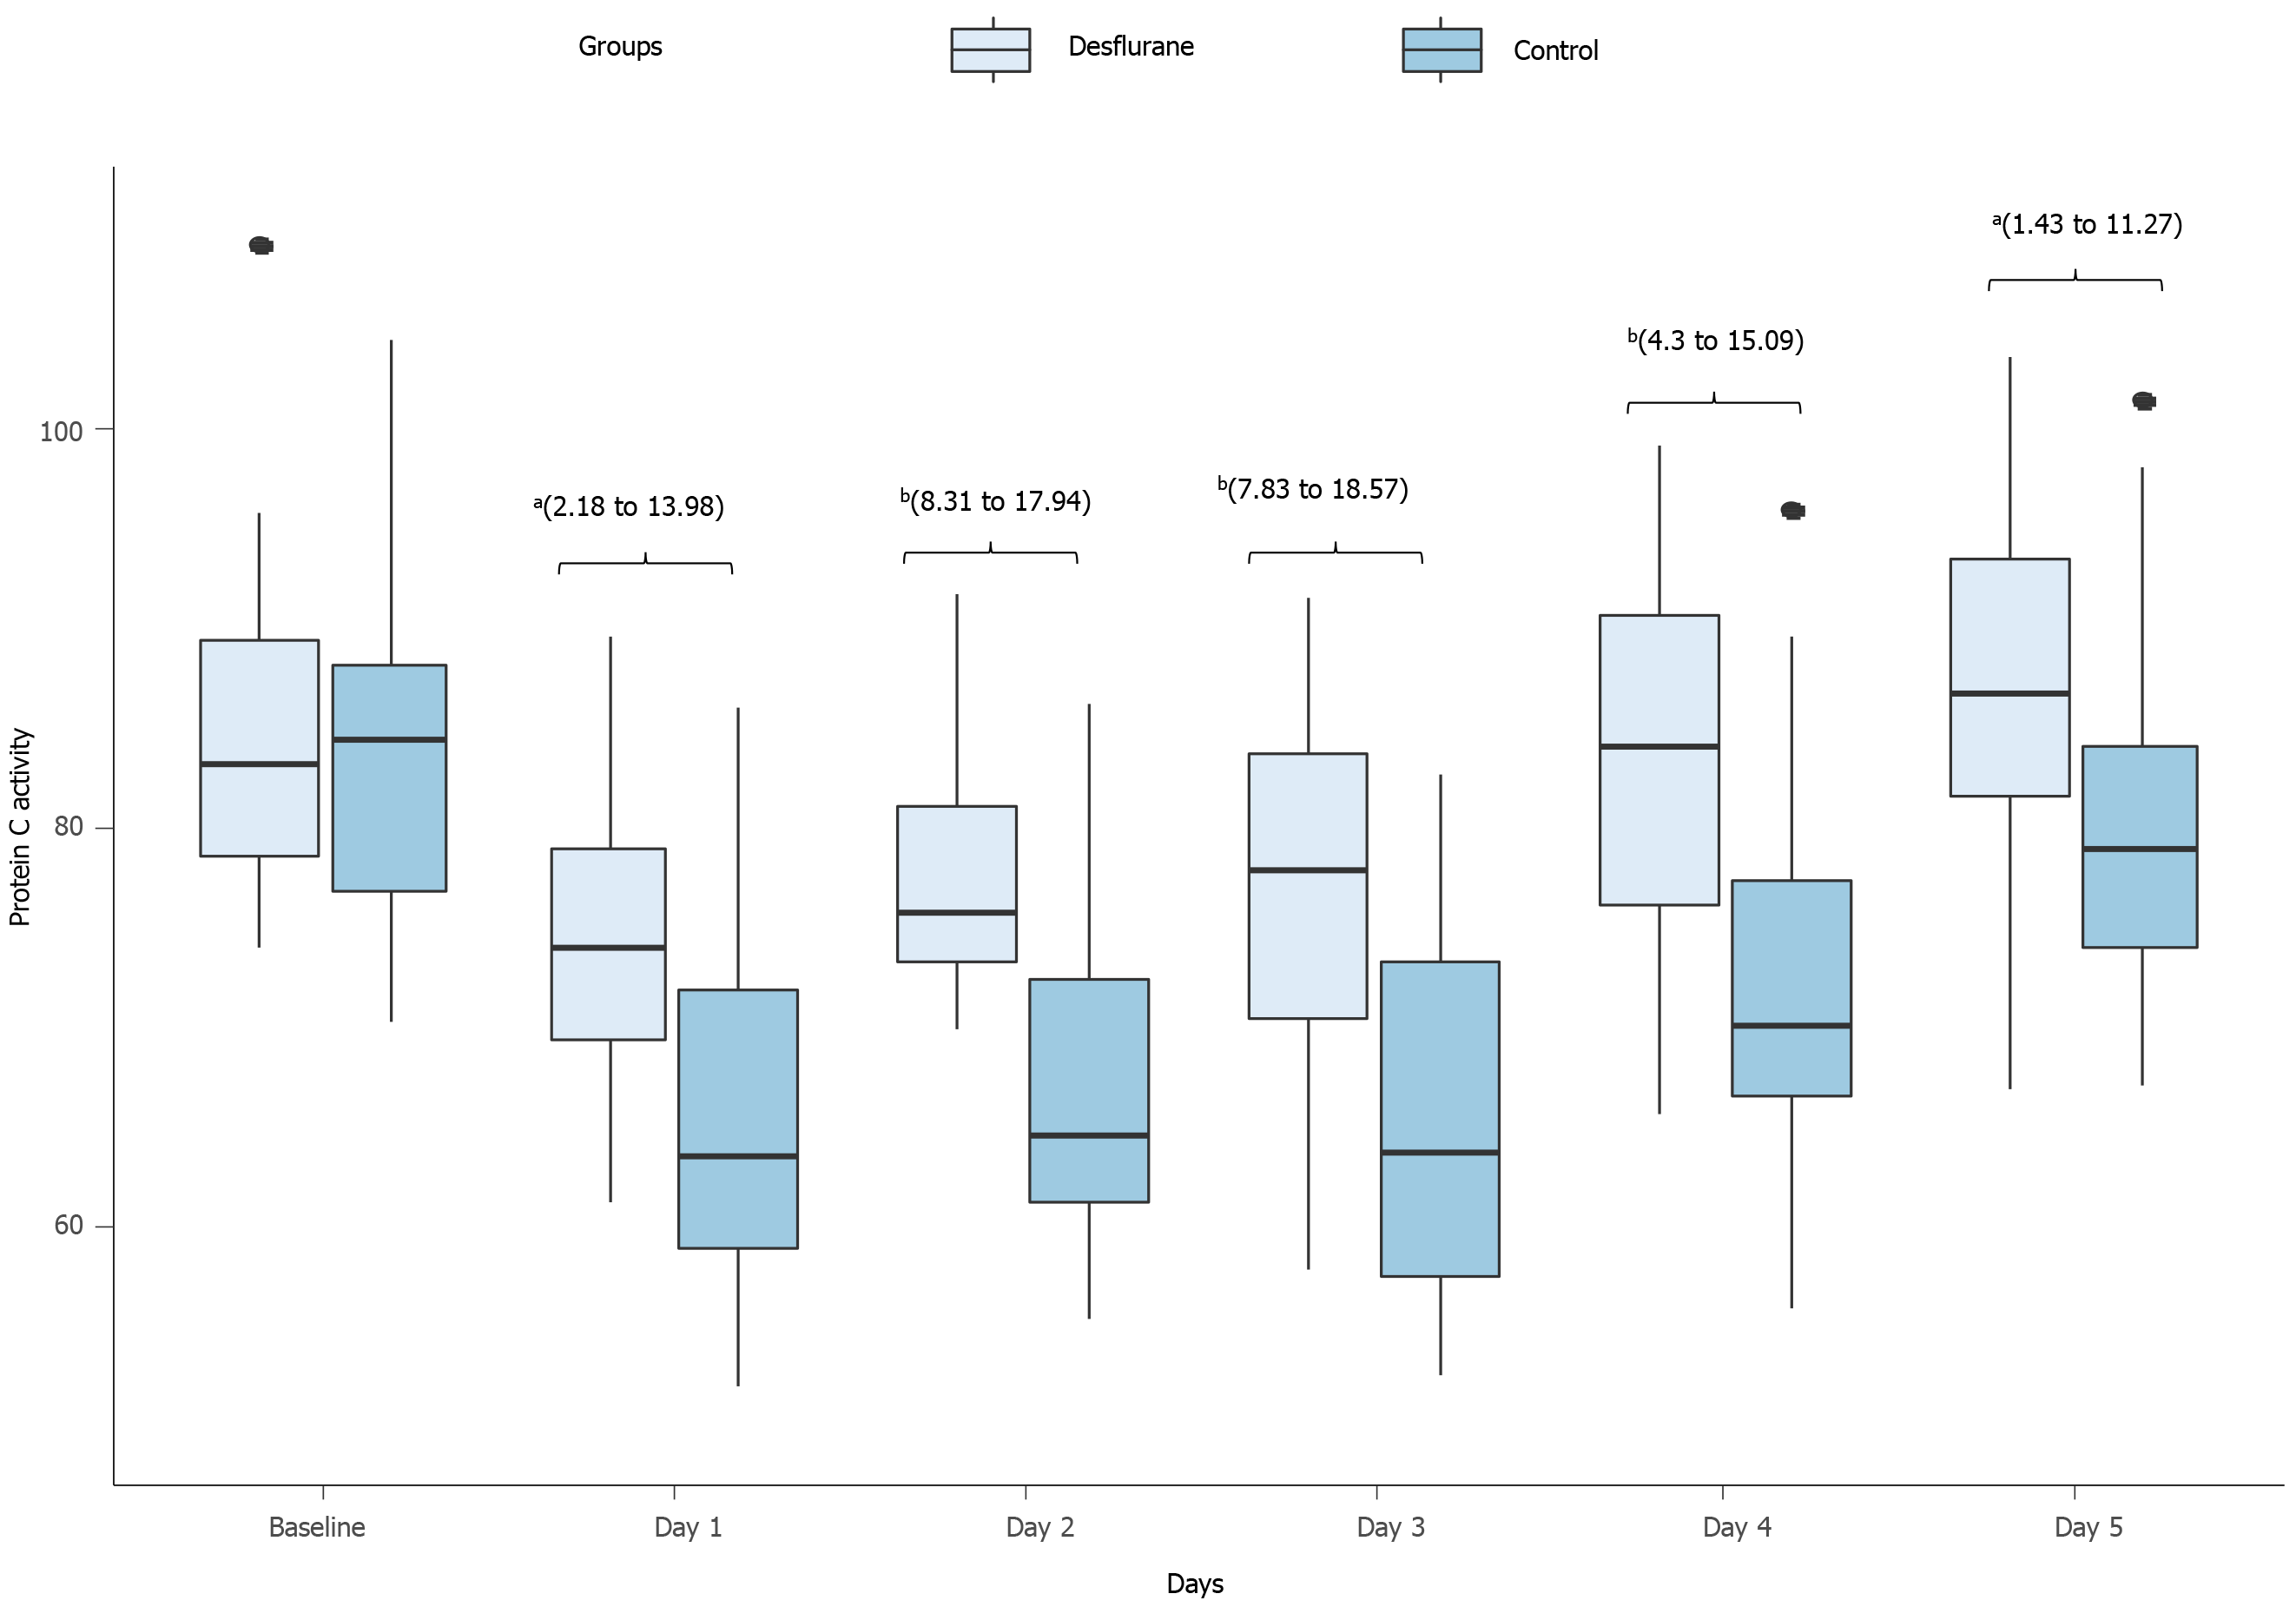
Figure 3 Protein C activity compared between groups.
The t-test was used for between-groups comparisons, resulting in P values and 95% confidence intervals (CIs, provided in brackets). aP < 0.05 statistical significance between desflurane vs control group, bP < 0.01 statistical significance between desflurane vs control group.
- Citation: Koraki E, Mantzoros I, Chatzakis C, Gkiouliava A, Cheva A, Lavrentieva A, Sifaki F, Argiriadou H, Kesisoglou I, Galanos-Demiris K, Bitsianis S, Tsalis K. Metalloproteinase expression after desflurane preconditioning in hepatectomies: A randomized clinical trial. World J Hepatol 2020; 12(11): 1098-1114
- URL: https://www.wjgnet.com/1948-5182/full/v12/i11/1098.htm
- DOI: https://dx.doi.org/10.4254/wjh.v12.i11.1098


